Forex Technical analysis for beginners
Technical analysis refers to a set of procedures used to estimate future price movements of financial instruments using historical price movements and trends.
Technical analysis is particularly well suited to foreign currency markets. Because of the high levels of liquidity in terms of trading volumes and the number of players, as well as susceptibility to large long-term national level trends, the Forex market tends to trend over time, and patterns frequently have the opportunity to fully unfold.
Simultaneously, technical analysis in Forex markets can be utilized to build and execute short-term trading strategies.
How to use Technical analysis for Forex trading
Alongside with Fundamental analysis, Technical one can be implemented for more accurate trading decision-making. Technical analysis is based on the idea that markets are chaotic (no one knows what might happen next), but price behavior is not wholly random. In other words, mathematical Chaos Theory establishes that discernible patterns tend to recur inside a state of chaos.
In nature, this type of chaotic activity can be seen in the form of weather forecasts. Most traders, for example, will concede that there are no guarantees when it comes to anticipating specific price fluctuations. As a result, successful trading is about assessing probabilities and taking transactions when the odds are in your favor rather than being accurate or incorrect.
Keep in mind that there is no miraculous combination of technical indicators that will reveal some sort of hidden trading approach. Good risk management, discipline, and the ability to keep your emotions in check are the keys to successful trading. Anyone can make a correct prediction and win once in a while, but without risk management, it is nearly hard to be successful in the long term.
As it was said before, Technical analysis is the study of historical price behavior in order to detect patterns and predict future market movements using technical studies, indicators, and other research tools.
Technical analysis is mainly about two things:
- recognizing a pattern/trend;
- identifying support and resistance using price charts and/or timeframes;
The markets may only move in three directions: up, down, or sideways.
Prices commonly move in a zigzag manner, therefore price action has only two states:
Range — when prices zigzag sideways.
Trend — when prices either zigzag higher (uptrend, or bull trend) or lower (downtrend, or bear trend) (downtrend, or bear trend);
A Forex market’s Technical analysis can help you determine not only when and where to enter a market, but also when and where to leave.
How to read Forex charts
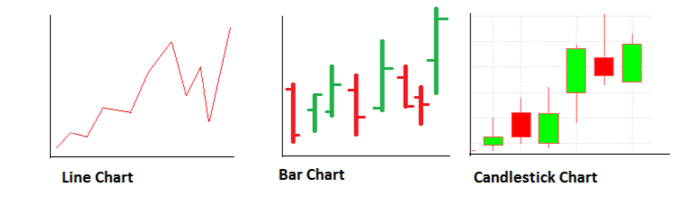
One of the first steps you’ll need to take if you want to start trading without the use of Copy trading is to learn how to read Forex charts. To help you get started, we explain how to interpret the four primary types of FX charts – a graphical representation of how an asset’s price changes over time.
Forex traders typically use one of three types of charts: Candlestick, Doji, HLOC, or line, each of which is read differently. Personal preference will determine the style of chart you select, while candlestick and HLOC charts are the most common because they reveal far more information than line charts.
Candlestick charts on FX charts
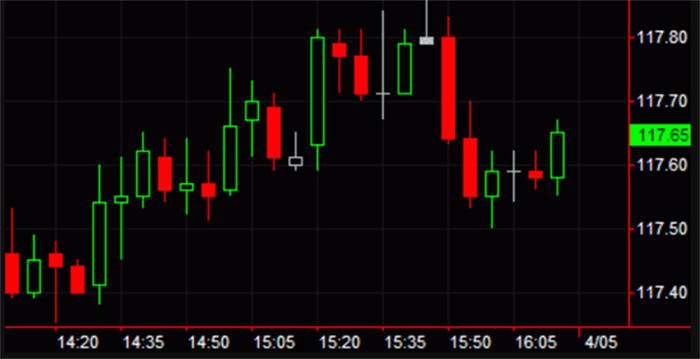
Candlestick charts exhibit pricing data in the shape of long, thin bars that resemble candles. Each candlestick depicts price change throughout the time period you specify. If you choose a 15-minute timeframe, for example, each candlestick on the chart will indicate how prices developed over a 15-minute period, except for the candlestick on the far right of the chart, which will represent live prices for the current – incomplete – period.
A green candlestick shows that the pair rose in price over the specified time period, closing at a higher price than it opened. A red candlestick, on the other hand, indicates that the price of the pair fell, closing at a lower level than it began.
Furthermore, each candlestick will display four different prices for the Forex pair:
- The price at the start of the term is referred to as the open price.
- The price at the end of the time is referred to as the close price.
- The most expensive price traded throughout the period is referred to as the high price.
- The period’s lowest traded price is referred to as the low price.
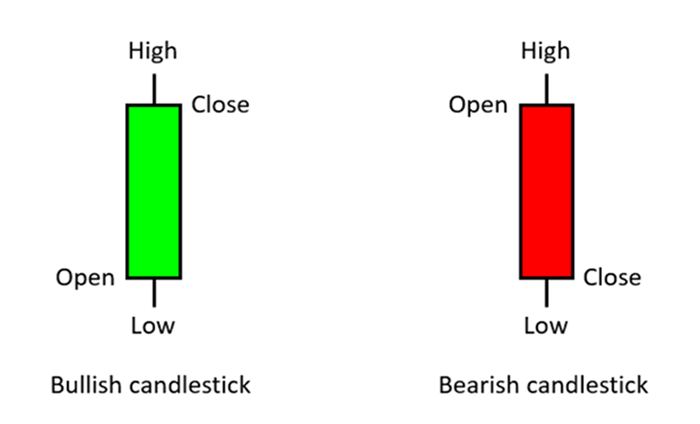
The relationship between the four prices represented by a candlestick can reveal a lot about how the market is defining and shaping and who is driving the market movements: buyers or sellers.
Long green candlesticks may suggest strong buying pressure, whilst long red candlesticks may signal strong selling pressure. Candlesticks with long wicks but short bodies, on the other hand, suggest that there was significant pressure in one direction, but the price was pulled back before the period ended.
Dojis on FX charts
Sometimes, the opening and closing market prices are the same (or very close), a cross known as a “doji” is formed. This reflects the market uncertainty, with neither buyers nor sellers able to have sufficient influence over the direction of price fluctuations. A doji is an unbiased arrangement with little meaning on its own. However, if a doji occurs within an uptrend or downtrend, it may imply that a trend reversal is coming.

HLOC or Bar on FX charts
HLOC – the following chart type – stands for “high, low, open, close” and displays the same data as a candlestick chart, but in a different way:
- The top of the vertical line represents the highest price.
- The low price is the vertical line’s lowest point.
- The notch to the left of the vertical line represents the open price.
- The notch to the right of the vertical line represents the close price.
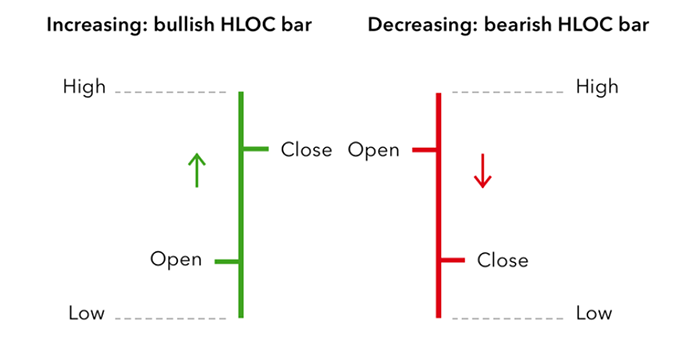
Again, the line would become green if the currency pair’s price increased during the specified period, closing at a higher price than when it began, and red if the pair’s price declined over the given period, wrapping up at a lower price than when it started. Dojis can form when the open and close prices are the same.
Line Charts
The line chart is a fairly basic approach to display pricing data since it does not show the high, low, or open price for the period. As a result, many Forex traders only utilize line charts when analyzing long-term trends, where some of the additional information may be less helpful than when trading short-term patterns. The close prices are combined so that the following points form a line.
Technical analysis indicators for Forex trading
Professional Forex traders utilize particular indicators on a regular basis to assist them to understand when it is appropriate to buy or sell in the currency market. These indicators are recognized as a crucial component of technical analysis, and every technical should be familiar with them.
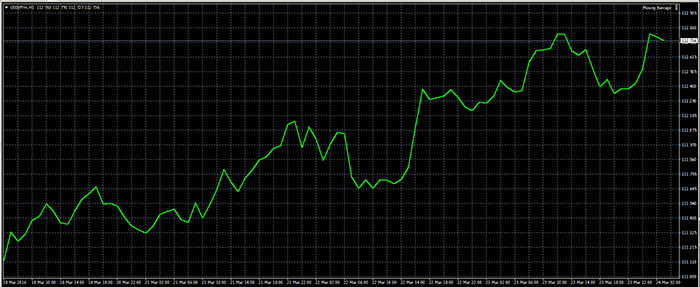
Moving Average trading indicator
Moving Average (MA) is a very helpful Forex indicator to get familiar with as it essentially shows the average price value over a certain time period. If the price trades are above the moving average, it implies that buyers are in control, and if the price trades are below the moving average, it indicates that sellers are in control.
As a result, in terms of trading strategies, a trader should prioritize buying when the price is above the moving average.
Bollinger Bands in FX
When it comes to defining the entry and exit points for a trade, the Bollinger bands indicator is used to measure the price volatility of a particular asset.
Bollinger bands are divided into three types: upper, middle, and lower brands. These bands are frequently used to identify overbought and oversold situations. The best thing about this indicator is that it helps characterize a financial instrument’s price and volatility over time.
Average True range (ATR) in FX
Market volatility is measured by the Average True Range indicator. The range is the important component of this indicator, and it is defined as the difference between periodic lows and highs.
The range could be used on any trading time, including intra-day and multi-day. The true range is used in the Average True Range.
True range is the most important of the three measures:
- The current high-to-low phase
- Previous high period that was close to the current high period
- A previous low period that was close to the current low period
The true range is the absolute value of the largest of the three ranges. The average true range (ATR), on the other hand, is the moving average of individual true range values.
Fibonacci index in FX
Fibonacci is another essential Forex indicator that reveals the market’s exact direction, and it is the golden ratio considered at 1.618.
This instrument is used by many Forex traders to pinpoint sectors and reversals where profit may be easily taken. Fibonacci’s levels are calculated when the market has made a large move up or down and appears to have flattened out at a given price level.
Fibonacci retracement levels are plotted to identify places where markets may retrace before returning to the trend generated by the first price action.
Relative Strength Index (RSI) in FX
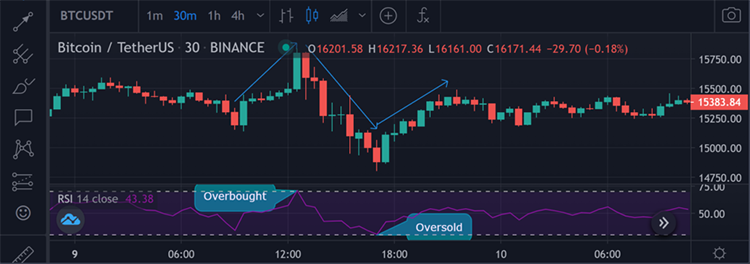
The Relative Strength Index (RSI) is yet another oscillator-categorized Forex indicator, widely used for displaying a temporary oversold or overbought condition in the market.
A RSI value greater than 70 indicates an overbought market, while a value less than 30 indicates an oversold market. As a result, some traders employ an 80 RSI number for overbought conditions and a 20 RSI value for an oversold market.
Pivot Point in FX
A Pivot Point displays the demand-supply balance levels of a pair of currencies. When the price reaches the pivot point, the demand and supply for that particular payment are equal.
If the price crosses the pivot point level, it indicates stronger demand for a currency pair, and if the price goes below the pivot point level, it indicates higher supply for a currency pair.
Stochastic in FX
Stochastic is recognized as one of the best Forex indicators for identifying momentum and overbought/oversold zones.
In Forex trading, the stochastic oscillator aids in identifying trends that are likely to reverse. A stochastic indicator can calculate momentum by comparing the closing price and trading range over a given time period.
Parabolic SAR (PSAR) in FX
Parabolic Stop And Reverse (Parabolic SAR, PSAR) is used by Forex traders to determine the direction of a trend and to identify price reversal points in the near future.
This indicator is primarily used to determine spot entry and exit points. On a chart, the PSAR shows as a series of dots below or above the price of an asset. If the dot is lower than the price, it indicates that the price is rising. If the dot is above the price, it indicates that the price is falling.
Donchian Channels in FX
By determining the higher and lower price action values, Donchian Channels assist Forex traders in understanding the market’s volatility.
Donchian channels are typically composed of three distinct lines produced by moving average calculations. Around the median, there are upper-lower bands. The Donchian channel is the area between the upper and lower bands.
Top brokers for Forex trading
Every short-term trader’s goal is to determine the direction of a given asset’s movement and benefit from it. There have been hundreds of technical indicators created for this purpose, so you can confidently use them to understand market patterns, create new trading strategies or explore merging them into existing ones. Try your hand at interpreting in a demo or real account of regulated Forex brokers listed below to see which ones you prefer.
These Forex brokers satisfy the high standards of the world’s strictest financial regulators and have been serving their consumers for decades. Though some of them have geographical restrictions, you can safely open an account with these reputable brokers wherever you are by using free VPS or VPN services. They offer the best selection of currency pairs, as well as other financial instruments such as stocks, commodities, and Cryptocurrencies, and some of the most favorable trading conditions, including Forex bonuses of up to $5000 even on initial deposits (subject to geographic availability), Copy trading, and negative balance protection.
Plus500 CFDs trading
Plus500 is a trustworthy broker that provides CFDs trading in over 60 currency pairs, commodities, equities, indices, and Crypto with “stop-loss” and “stop-limit” features. The first is intended to protect against transaction losses, while the second orders the broker to sell assets if their quotations fall below a certain threshold specified by the trader.
It only takes a few minutes to open an account. Furthermore, before progressing to the next level, you can practice trading ploys on a free, unlimited demo account. To deposit and withdraw funds from your account, you can use Visa and MasterCard credit/debit card transfers, Paypal, Bank Transfers, BPay, Skrill, and other options.
Clients can access the Plus500 trading platform via a web interface for PCs and laptops, as well as a mobile app for Android and iOS.
Plus500 is fully licensed and authorized to operate globally, adhering to the regulations of regulatory bodies such as CySEC, FCA, ASIC, etc.


82% of retail investor accounts lose money when trading CFDs with this provider. You should consider whether you can afford to take the high risk of losing your money.
eToro FX trading
eToro is one of the most well-known brokers in the world, when it comes to online trading,. You can trade and invest in over 2000 different assets with the best conditions: minimal Forex and trading costs and minimum deposits. Since 2017, new digital currencies such as Bitcoin, Ethereum, and others have been added to the list. Popular currency pairs, equities, Cryptocurrencies, commodities, ETFs, and indices are shown for you to select for your transactions.
eToro offers two types of accounts: for both retail and professional clients. The first is protected against negative balance and has a CopyTrader feature, while the second is distinguished by its infinite leverage. Furthermore, newcomers can always use a demo account to experiment with and try new techniques.
The broker has millions of clients worldwide and is backed up by licenses that allow eToro to operate in different countries throughout the world, as it is regulated by the FCA, ASIC, and CySEC.
OANDA FX trading
OANDA is a well-known broker for traders worldwide. Over 100 financial products, including currency pairs, cryptocurrencies, indices, commodities, bonds, and metals, are available for trading. The broker’s nine basic currencies are EUR, GBP, CHF, USD, CAD, AUD, JPY, HKD, and SGD.
OANDA is widely recognized as one of the most trustworthy Forex brokers. It is licensed to operate in several countries and a member of the following regulatory bodies: IIROC, FCA, and ASIC.
Furthermore, the broker offers three account types worldwide: demo, standard, and advanced trader, making it suitable for both novice and experienced traders. Furthermore, OANDA encourages traders to test their skills by using a demo account with an unlimited amount of virtual cash and an indefinite length of use.
AvaTrade FX trading
AvaTrade is a broker that provides not only a large number of financial instruments (1250 in total), but also a number of solutions for automatic trading, Social trading, and mobile trading, including MetaTrader 4/5, WebTrader, AvaOptions, AvaSocial, AvaTradeGo, and Autotrading.
The broker offers two types of accounts – demo and real – to make trading easier and more convenient. On the first, you can practice your trading tactics with a virtual balance of $100,000 and become a great pro trader. In the meantime, the actual one provides competitive spreads and trading with leverage.
Among other advantages, the company is concerned about the security of its clients’ funds and provides them with software such as AvaProtect. It is a risk management instrument that protects against loss on a specific position for a set length of time.
NAGA Markets FX trading
NAGA Markets is a top-rated broker that allows you to trade currency pairs (majors, minors, and exotics), equities, exchange-traded funds (ETFs), futures, commodities, and metals. There are various trading platforms accessible, including MetaTrader 4 and 5, as well as NAGA Webtrader, the broker’s original platform, including mobile versions.
Also, NAGA is a social trading network where clients of all levels of experience may trade, share, and replicate assets on over 950 different trading instruments. Tight spreads, low expenses, rapid trade execution, and a variety of configurable account financing ways define the broker’s trading conditions.
NAGA’s objective is to make trading simple and accessible to anybody, thus the broker abides by different regulatory laws around the world, including the FCA, CySEC, MiFID II, and MiFIR, in order to provide investment services to clients in multiple jurisdictions.

XM Group FX trading
XM Group is an international online Forex broker that offers over 1000 trading instruments, including over 55 currency pairings, metals, commodities, and equities, all of which may be traded on the MT4/MT5 platforms. The broker now offers a mobile app that allows you to trade in foreign exchange markets with a single login on a demo or live account.
Furthermore, the broker provides a virtual private server (VPS) service, allowing clients to fully experience all of the benefits of trading with XM without worrying about other factors that can slow down or disrupt high-quality transactions, such as Internet connection speed or power outages.
One of the many benefits of XM Group is that deposits and withdrawals are free: the broker covers all payment system commissions. The most profitable trading accounts with negative balance protection, and tight spreads include Micro, Standard, XM Ultra Low, and Shares. A broker was licensed by regulators such as CySEC, IFSC, DFSA, and ASIC to guard the safety of traders worldwide.

As you can see, all of the brokers listed above have impeccable licensing, user-friendly trading platforms, appealing bonuses, and unique terms for each client. The good news is that you don’t have to choose just one. On the contrary, by registering and verifying an account with several Forex brokers, you can not only obtain all of the benefits that are on the table for you, but also compare trading terminals, test different techniques, and quickly become a true professional.