How to trade US30: comprehensive guide to indicators, strategies, and the best FX brokers
The US30, also known as the Dow Jones Industrial Average (DJIA), is one of the most widely recognized indices in global markets, representing 30 of the largest companies in the United States. For traders, understanding how to analyze and trade this index effectively can be highly rewarding, but it requires knowledge of key indicators and chart techniques. In this article, we’ll dive into the technical analysis of the US30, exploring essential tools like moving averages, Bollinger Bands, MACD, and RSI to help you interpret market trends and volatility. We’ll also outline expert trading strategies and highlight the top FX brokers where you can start trading US30 CFDs.
A detailed explanation of the US30 chart analysis
Disclaimer: This is a beginner’s guide to analyzing charts and not an investment recommendation. The real chart used here is taken from the Investing.com website for illustrative purposes only.
US30 technical indicators explained
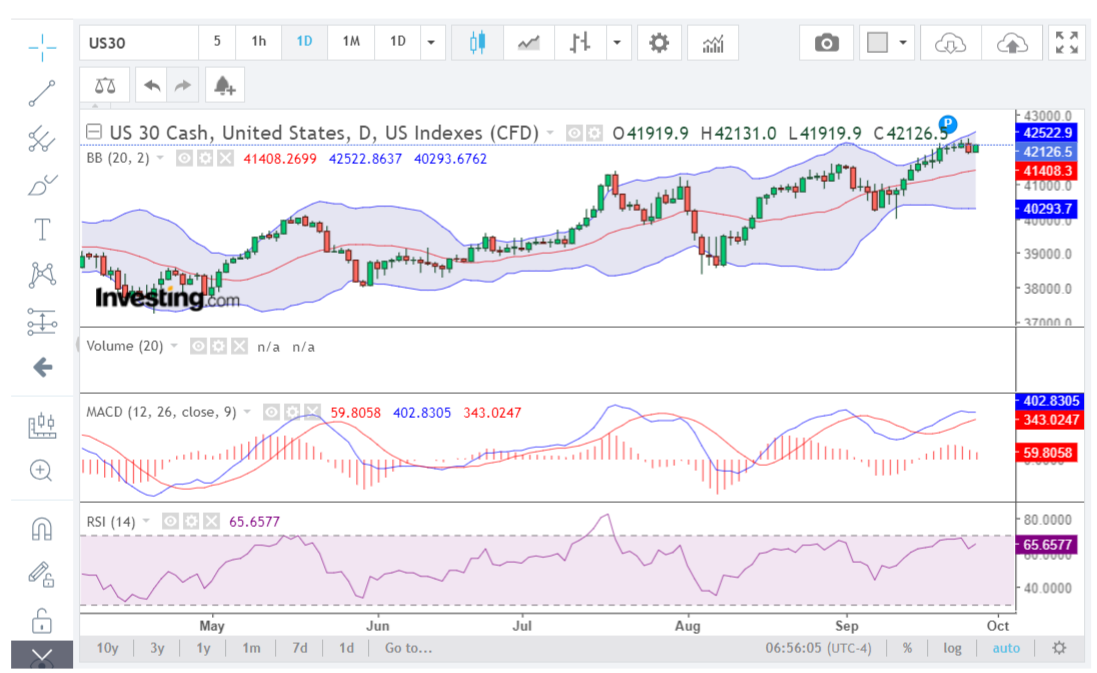
The chart represents the daily price movement of the US30 (Dow Jones Index) in the form of candlesticks. It uses Bollinger Bands (BB), MACD (Moving Average Convergence Divergence), and RSI (Relative Strength Index) as technical indicators. Each of these provides insights into trend direction, momentum, and volatility, which are crucial for traders.
1. Bollinger Bands (BB)
What are Bollinger Bands? Bollinger Bands consist of three lines:
- The middle band is a 20-day simple moving average (SMA), which smooths out price data to show the overall trend direction.
- The upper band and lower band are two standard deviations away from the middle band. The wider the bands, the higher the volatility; the narrower the bands, the lower the volatility.
Key insights:
- Upper band interaction: When the price touches or exceeds the upper band (as it is currently close to doing in this chart), this suggests that the price is overbought or has increased rapidly in a short period. Traders might look for a potential pullback or correction after such a move.
- Lower band interaction: On the other hand, if the price touches or breaks through the lower band, it often indicates oversold conditions, meaning the price has dropped too fast and might reverse upwards.
- Middle band: In this case, the middle red line (around 41408) serves as a key support level. If the price retraces, traders may use this as an opportunity to enter or add to long positions in an ongoing uptrend.
Volatility expansion: Notice how the Bollinger Bands are expanding, suggesting increased volatility. When bands widen, it means price movements are becoming larger, potentially signaling big upcoming price swings.
2. MACD (Moving Average Convergence Divergence)
What is MACD? MACD is a trend-following momentum indicator that reveals the relationship between two moving averages of an asset’s price. It consists of:
- The MACD line (blue), calculated by subtracting the 26-day EMA from the 12-day EMA.
- The Signal line (red), which is a 9-day EMA of the MACD line.
- The Histogram shows the difference between the MACD and Signal lines, giving a clear visual of momentum.
Pro tip: Check out how to use Moving Averages in CFD trading.
Key insights:
- Bullish signal: When the MACD line crosses above the signal line, as it currently is, this signals a potential buy opportunity as momentum is increasing to the upside.
- Bearish signal: If the MACD line crosses below the signal line, it would suggest a possible downward move or a sell signal.
- Histogram bars: The red histogram bars indicate the current difference between the MACD and signal lines. As they get smaller, it shows that the momentum is weakening even though it’s still bullish. Traders should keep an eye on these bars: if they turn negative, it suggests momentum is turning bearish.
What does it say now? The MACD line is above the signal line, confirming an uptrend. However, the diminishing size of the histogram bars indicates that bullish momentum is weakening, which might signal a potential price slowdown or even a reversal in the near future.
3. RSI (Relative Strength Index)
What is RSI? RSI is a momentum oscillator that measures the speed and change of price movements on a scale of 0 to 100. Typically:
- Values above 70 are considered overbought, which could signal that the asset is overvalued, and a price reversal or pullback may occur.
- Values below 30 are considered oversold, indicating that the asset may be undervalued and due for a reversal upwards.
Key insights:
- Current RSI level (65.65): The RSI is at 65.65, which is getting close to the overbought territory of 70 but has not yet crossed it. This suggests that while there is strength in the current price movement, it may soon reach a level where buying pressure could ease, leading to a potential price correction.
- Trend strength: RSI shows that the upward trend is strong but nearing overbought levels. A value near 70 typically signals to traders that caution is needed, as a pullback might happen soon.
What does it say now? The RSI indicates that the price is still in a healthy uptrend but close to becoming overbought, which may lead to profit-taking or a corrective move in the near future.
Analysis of the US30 trend, momentum, and volatility
Trend:
- The price is in a strong uptrend. Higher highs and higher lows confirm this, and the price continues to push upwards.
- Bollinger Bands and the MACD both show the trend is still bullish, but the RSI is getting close to indicating overbought conditions, meaning this trend could slow or reverse in the near term.
Momentum:
- MACD shows bullish momentum, though it’s weakening as the histogram bars shrink. This suggests that while the price is still rising, the strength of the upward movement is losing steam.
- RSI near 70 also shows that buying pressure is high, but overbought conditions could soon trigger a reversal.
Volatility:
- Bollinger Bands are expanding, indicating increasing volatility. Larger price swings could occur, meaning there is a higher risk of sudden price movements, either upward or downward.
US30 predictions and trading plan
Price prediction:
- Short-term: The price is likely to continue rising in the short term, potentially testing the 42522 level (upper Bollinger Band).
- Medium-term: A price correction is likely once the RSI hits 70 or above. A pullback towards the middle Bollinger Band (41400 area) could happen, especially if momentum continues to weaken.
Trading plan:
Bullish plan (long position):
- Entry: Wait for a small pullback, ideally near the middle Bollinger Band (41400) to enter a long position.
- Target: Set a target around the 42500 level (upper band), anticipating a continued upward move before a correction.
- Stop-loss: Place a stop-loss below the lower Bollinger Band (40300), in case of an unexpected reversal.
More about bulls and bears in the Forex market.
Bearish plan (short position):
- Entry: If the price reaches the upper Bollinger Band (42500) and the RSI exceeds 70, consider shorting the market, as the asset may be overbought.
- Target: Set a target near the middle Bollinger Band (41400).
- Stop-loss: A stop-loss above 43000 will protect against further upside risk.
This chart shows a bullish trend with increasing volatility and weakening momentum. Traders should watch for potential pullbacks as the RSI approaches overbought levels and MACD momentum slows down. Both long and short trading opportunities are available, but caution is warranted due to potential price corrections. Remember, these indicators help guide decisions, but they are not foolproof. Always do additional research and risk management before making any trades.
Top Forex brokers to trade US30
Choosing the right broker is essential for trading the US30 index effectively. Factors such as low spreads, high liquidity, and the availability of advanced trading platforms can significantly impact your trading performance. After analyzing the technical aspects and strategies of trading the US30, the next step is identifying the best brokers that cater to this market. Below, we’ve compiled a list of top FX brokers that offer seamless access to the US30, competitive trading conditions, and powerful tools to enhance your trading experience. These brokers are highly reputable, provide excellent customer support, and offer diverse trading options, making them ideal for both new and seasoned traders.
Pro tip: Before choosing a Forex broker, check Forex brokers with the best reputation among real traders.
Exness US30 trading
Exness stands out as a solid option for traders, offering a wide variety of assets such as US30 CFDs, currency pairs, commodities, indices, and cryptocurrencies. With regulation from both the UK’s FCA and Cyprus’ CySEC, Exness ensures a safe trading environment. The broker’s Standard and Professional accounts come with competitive spreads and tailored features for different trading needs. Traders can access support easily via email, live chat, or phone. Additionally, Exness supports MetaTrader 4 (MT4) and MetaTrader 5 (MT5), providing an intuitive platform with advanced charting tools. Overall, Exness delivers a well-rounded trading experience that’s worth considering.

HF Markets US30 trading
HF Markets is a fantastic option for traders looking for a wide range of assets. With access to over 1,200 financial instruments, including currency pairs, energies, indices, commodities, ETFs, stocks, and bonds, there’s plenty to choose from. The broker supports multiple platforms, such as MT4 and MT5, which are available on desktop, web, and mobile. They also offer a user-friendly app and a VPS service for improved performance. HF Markets provides several account types—Premium, Pro, Zero, and Cent—each with different minimum deposits, leverage options, and spreads to cater to various trading styles. For beginners, a demo account is available to practice and get comfortable with trading strategies before investing real money.

eToro US30 trading
Founded in 2007, eToro has revolutionized cryptocurrency trading, making it accessible and engaging worldwide. As a leader in the space, eToro features a user-friendly platform with innovative tools like Social Trading, allowing users to follow and replicate the trades of experienced investors.
The platform facilitates connections with other traders, enabling you to mirror strategies and trade both FX and cryptocurrencies without extra fees. Its intuitive design includes advanced charting tools and CopyPortfolios for investing in professionally managed portfolios.
Getting started is easy: sign up, verify your identity, and deposit funds via various payment methods. Once set up, you can explore assets, define trade parameters, and begin trading seamlessly.
Risk disclaimer: eToro is a multi-asset platform which offers both investing in stocks and cryptoassets, as well as trading CFDs.
CFDs are complex instruments and come with a high risk of losing money rapidly due to leverage. 51% of retail investor accounts lose money when trading CFDs with this provider. You should consider whether you understand how CFDs work, and whether you can afford to take the high risk of losing your money.
This communication is intended for information and educational purposes only and should not be considered investment advice or investment recommendation. Past performance is not an indication of future results.
Copy Trading does not amount to investment advice. The value of your investments may go up or down. Your capital is at risk.
Don’t invest unless you’re prepared to lose all the money you invest. This is a high-risk investment and you should not expect to be protected if something goes wrong. Take 2 mins to learn more.
eToro USA LLC does not offer CFDs and makes no representation and assumes no liability as to the accuracy or completeness of the content of this publication, which has been prepared by our partner utilizing publicly available non-entity specific information about eToro.
AvaTrade US30 trading
AvaTrade, established in 2006, is a reputable Forex broker with over 300,000 clients globally. Regulated by top authorities like the Central Bank of Ireland and ASIC, it’s a trustworthy choice for cryptocurrency trading.
AvaTrade offers competitive spreads, flexible leverage, and various account types to fit different trading styles. The platform supports popular trading software like MT4 and MT5, featuring advanced charting tools and fast execution. Additionally, it includes essential risk management tools, such as stop-loss and take-profit orders, along with valuable educational resources like webinars and market analysis.
XTB US30 trading
XTB stands out with a significant global presence, operating in over 190 countries while ensuring strong security and transparency. Regulated by major authorities like the FCA, CySEC, and KNF, it offers a trustworthy trading environment.
Traders can access versatile platforms such as xStation and MetaTrader 4, equipped with advanced tools for trading various instruments, including US30. XTB also provides flexible account options, including Standard and swap-free accounts, to suit different trading preferences. Additionally, the broker offers valuable resources like daily market updates, economic calendars, and educational webinars, enhancing the overall trading experience.
Related articles:
- Dow Jones Industrial Average analysis: a deep dive into indicators, trends, and predictions
US30 analysis - FAQ