Mastering Netflix (NFLX) stock: indicators, strategies & Top FX brokers

Netflix Inc. (NFLX), a leading player in the streaming industry, has become one of the most popular stocks among both retail and institutional investors. With its volatile price movements and active trading volume, NFLX offers a range of opportunities for traders looking to capitalize on its trends. In this guide, we’ll break down the essential tools and strategies you need to analyze Netflix stock effectively. From technical indicators like Bollinger Bands and Moving Averages to charting techniques and expert trading strategies, this article will equip you with practical insights to make informed trading decisions.
A detailed Netflix (NFLX) stock chart analysis

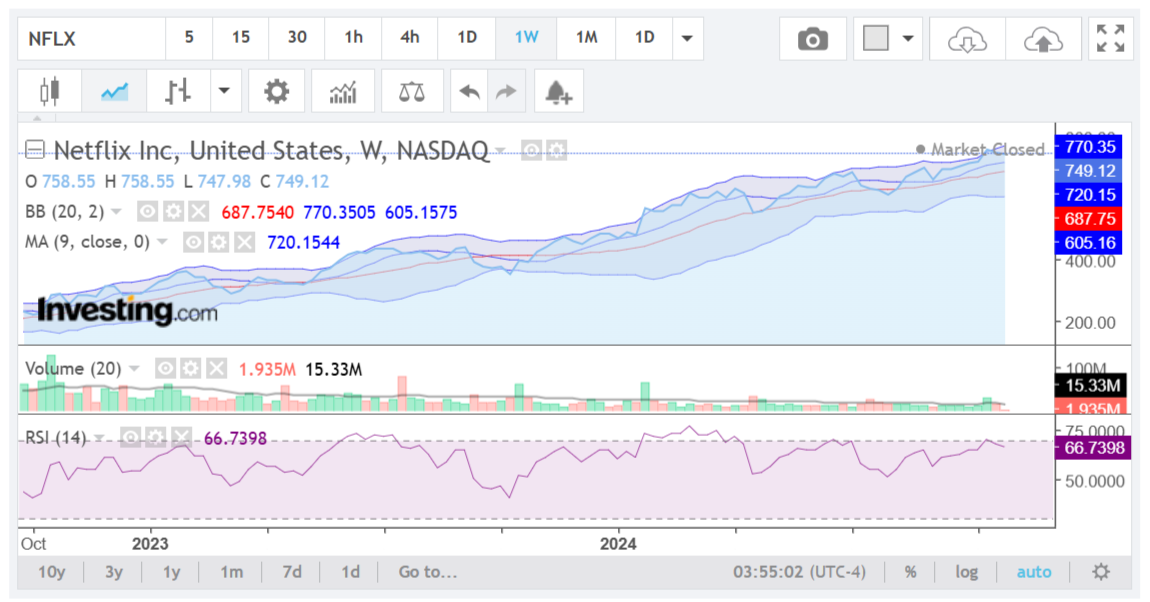
The real chart of Netflix (NFLX) stock shown here is sourced from Investing.com. This analysis is meant purely as an educational guide for beginners on how to analyze stock charts and should not be interpreted as financial advice or a trading recommendation.
Time period, and indicators of Netflix (NFLX) stock chart
This chart displays weekly data for NFLX over the past year, which gives a medium-to-long-term view of the stock’s trend and price action.
Several indicators are shown on this chart:
1. Bollinger Bands (BB, 20, 2):
- Upper Band (770.35 in blue), Middle Band (moving average of 20 periods, 720.35 in purple), and Lower Band (605.16 in blue).
- Bollinger Bands are commonly used to assess volatility. Wider bands indicate higher volatility, while narrower bands suggest a period of consolidation.
- Currently, NFLX is trading near the upper band, which often indicates a bullish momentum, but it may also suggest that the stock is overbought and could see a short-term pullback.
2. Moving Average (MA, 9 periods):
- This moving average line (720.15, shown in blue) smooths out price fluctuations and provides a trend-following signal.
- NFLX is trading above this 9-period MA, a bullish sign, as prices above the moving average indicate an uptrend.
→ More about how to use Moving Averages in CFD trading.
3. Relative Strength Index (RSI, 14 periods):
- The RSI value is 66.74 (purple line), nearing the overbought zone (typically above 70).
- An RSI around 70 suggests that a stock is approaching overbought conditions and may be due for a pullback, although strong uptrends can remain in overbought territory for extended periods.
Volume, trend, momentum, and volatility of Netflix (NFLX) stock chart
- Volume: Recent weekly volume levels are around 15.33 million shares, with some red and green bars indicating the volume of selling and buying, respectively.
Rising volume in the direction of the trend (in this case, bullish) can confirm the strength of the movement. However, a divergence between volume and price might suggest weakening momentum. - Trend: The NFLX stock shows a strong upward trend, as evidenced by the consistent price action above both the Bollinger Bands’ middle line and the 9-period moving average.
- Momentum: Momentum indicators like the RSI show a positive upward force but are nearing potential overbought territory. This suggests that while bullish momentum is present, caution is needed.
- Volatility: With the Bollinger Bands widening and the price near the upper band, the volatility is moderately high. This may lead to larger price swings, and investors should watch for possible corrections.
Price prediction and trading plan of Netflix (NFLX) stock
- Prediction: Given the current trend, it’s likely that NFLX could continue upward as long as it stays above the 9-period MA and the middle Bollinger Band. However, since the RSI is close to the overbought zone, there might be a short-term pullback before any continuation.
Trading plan:
- If bullish: Consider entering if the price retraces toward the middle Bollinger Band or the 9-period MA as support around $720. Monitor for a potential breakout above the upper band if volume supports it.
→ More details regarding bulls and bears in the Forex market.
- If cautious: Set stop-losses slightly below the 9-period moving average to manage risk.
- If looking for a pullback: Watch for RSI to dip below 70, or for a retest of lower Bollinger Band support.
As a beginner, it’s important to remember that indicators do not guarantee price movement, and they should be used in combination with other analysis tools and news events related to Netflix’s business. This guide is for educational purposes only and illustrates how traders might interpret trend and momentum indicators.
Top Forex brokers to trade Netflix (NFLX) stock
When it comes to trading Netflix (NFLX) stock, choosing the right broker can make a significant difference in your trading experience. From platform features to fee structures and customer support, each broker has unique offerings tailored to different types of traders. In this section, we’ll explore the top brokers for trading Netflix stock, highlighting those that provide advanced charting tools, low spreads, and efficient execution to help you make the most of your trades.
Just a reminder: Before signing up with a Forex broker, check Forex brokers with the best reputation among real traders.
XTB Netflix stock trading
XTB is a top-tier broker with a vast global presence, operating in over 190 countries and offering exceptional security and transparency. Regulated by trusted authorities like the FCA, CySEC, and KNF, XTB ensures a high level of trust and oversight for traders. With powerful trading platforms like xStation and MetaTrader 4, XTB provides advanced tools for trading not only currency pairs but also stocks, including Netflix Inc. (NFLX.US). Traders can invest in Netflix with zero commission, with a minimum transaction value of 10 USD. Additionally, XTB offers NFLX.US – Cashstocks and NFLX.US – Stock CFDs, along with flexible account options like Standard and swap-free accounts, catering to a variety of trading styles and strategies.
AvaTrade Netflix stock trading
Established in 2006, AvaTrade is a trusted Forex broker with over 300,000 clients worldwide and is regulated by top authorities such as the Central Bank of Ireland and ASIC. Known for its reliability, AvaTrade offers a robust platform for trading cryptocurrencies, along with competitive spreads, flexible leverage, and various account options. With AvaTrade, you can also trade Netflix stock with leverage of up to 5:1, allowing you to maximize potential profits with minimal capital investment.
XM Group Netflix stock trading
XM Group, founded in 2009 and based in Belize, is a trusted broker for Forex and CFD trading, known for its low minimum deposit and strong regulatory oversight from CySEC and the FCA. Ensuring account security with features like 2-step authentication, XM provides a secure environment for traders. It offers a wide array of trading options—currency pairs, stocks, commodities, and indices—making it easy to diversify portfolios. With competitive spreads and flexible account types, XM caters to both beginners and experienced traders.
At XM, you can trade Netflix (NFLX.OQ) stocks as cash CFDs, which replicate the cash price of the underlying stock and adjust for corporate actions. Benefits of trading Netflix with XM include zero commissions, zero fees, and low margin requirements.
OANDA Netflix stock trading
OANDA is a trusted online broker known for its reliability and exceptional customer service, offering a secure trading environment with competitive spreads and customizable leverage to fit various trading strategies and risk profiles. Traders can access popular platforms like MetaTrader 4 and OANDA’s proprietary platform, OANDA Trade, which features advanced charting tools and expert advisors for technical analysis and algorithmic trading. OANDA also provides extensive resources, including daily and weekly market analysis, Forex news, and expert insights to enrich the trading experience. Additionally, you can trade Netflix Inc. (NFLX) shares as CFDs with OANDA.
eToro Netflix stock trading
eToro is a popular online trading platform known for its user-friendly interface and innovative social trading features, making it an excellent choice for both beginner and experienced traders. Regulated by top-tier authorities like the FCA, CySEC, and ASIC, eToro provides a secure and transparent environment for trading a wide range of assets, including stocks, cryptocurrencies, commodities, and indices.
When it comes to trading Netflix (NFLX) on eToro, users have the flexibility to invest directly in Netflix stock or trade it as a CFD, allowing them to profit from both rising and falling markets. eToro’s low-commission stock trading ($1 for most GEOs) for U.S. stocks like Netflix is particularly appealing, as traders can buy and hold NFLX shares without paying extra fees. For those interested in short-term gains or leveraged positions, eToro offers CFD trading with up to 5:1 leverage on Netflix, allowing traders to amplify their exposure with minimal capital.
Risk disclaimer: eToro is a multi-asset platform which offers both investing in stocks and cryptoassets, as well as trading CFDs.
CFDs are complex instruments and come with a high risk of losing money rapidly due to leverage. 61% of retail investor accounts lose money when trading CFDs with this provider. You should consider whether you understand how CFDs work, and whether you can afford to take the high risk of losing your money.
This communication is intended for information and educational purposes only and should not be considered investment advice or investment recommendation. Past performance is not an indication of future results.
Copy Trading does not amount to investment advice. The value of your investments may go up or down. Your capital is at risk.
Don’t invest unless you’re prepared to lose all the money you invest. This is a high-risk investment and you should not expect to be protected if something goes wrong. Take 2 mins to learn more.
eToro USA LLC does not offer CFDs and makes no representation and assumes no liability as to the accuracy or completeness of the content of this publication, which has been prepared by our partner utilizing publicly available non-entity specific information about eToro.
Related articles:
Netflix stock chart analysis - FAQ