EUR/USD trading essentials: top indicators and best Forex brokers
The EUR/USD currency pair is a major player in the Forex market, attracting both new and experienced traders. As the most frequently traded pair, it offers numerous opportunities but also presents its own set of challenges. To navigate this market effectively, it’s crucial to understand the key indicators and charting techniques that can guide your trading decisions. In this article, we’ll break down the essential tools you need for analyzing the EUR/USD, share some advanced charting methods to boost your analysis and recommend top FX brokers that can support your trading journey. Whether you’re refining your strategy or searching for the right broker, this guide will provide valuable insights to help you succeed in the EUR/USD market.
NOTE: Check out the article Mastering the USD/EUR currency pair trading: strategies for success with reliable FX brokers
Analyzing EUR/USD: key indicators, predictions, and trading plan
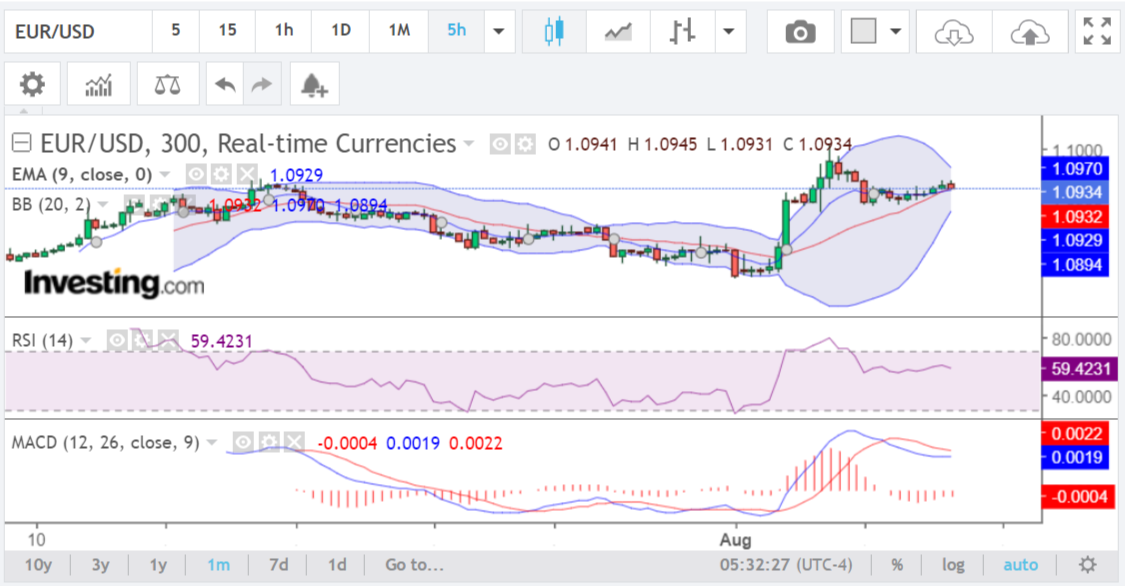
This analysis is based on a chart from Investing.com and is intended as a beginner’s guide for understanding chart indicators. It does not constitute trading advice but rather aims to help you learn how to interpret different technical signals.
EUR/USD chart indicators
Exponential Moving Average (EMA)
- Period: 9
- Current EMA: 1.0932
- Current price: 1.0934
- Explanation: The EMA is a type of moving average that gives more weight to recent prices, making it more responsive to new information compared to the Simple Moving Average (SMA). The 9-period EMA tracks short-term price movements. Since the current price (1.0934) is slightly above the EMA (1.0932), it indicates a small upward trend. This suggests that recent price action has been slightly stronger than the average over the past 9 periods.
Bollinger Bands (BB)
- Period: 20
- Standard deviation: 2
- Explanation: Bollinger Bands consist of three lines: the middle band (SMA), and two outer bands that are standard deviations away from the SMA. The bands expand and contract based on market volatility.
- Widening bands: When the bands are widening, it signals increased volatility and potentially more significant price swings.
- Price near upper band: If the price is approaching the upper band, it may indicate that the asset is becoming overbought, meaning it could be due for a price correction or pullback to the middle band.
Relative Strength Index (RSI)
- Period: 14
- Current RSI: 59.4231
- Explanation: The RSI measures the speed and change of price movements on a scale from 0 to 100. It is used to identify overbought or oversold conditions.
- RSI values: Generally, an RSI above 70 suggests overbought conditions (potentially overvalued), while an RSI below 30 suggests oversold conditions (potentially undervalued).
- Current RSI at 59.4231: This indicates that the asset is in a mild bullish phase, with some upward momentum, but it is not in the overbought range.
Moving Average Convergence Divergence (MACD)
- MACD line: 0.0019
- Signal line: 0.0022
- MACD histogram: -0.0004
- Explanation: The MACD is a trend-following momentum indicator that shows the relationship between two moving averages of an asset’s price.
- MACD line vs. signal line: When the MACD line (the difference between the 12-day and 26-day EMAs) is below the signal line (a 9-day EMA of the MACD line), it can indicate a bearish trend.
- Negative histogram: The histogram represents the difference between the MACD line and the signal line. A negative histogram suggests that the MACD line is below the signal line, reinforcing the bearish signal.
EUR/USD predictions and trading plan
Price prediction:
- Short-term trend: The short-term trend is mildly bullish based on the EMA.
- Volatility: The widening Bollinger Bands suggest increased market volatility, with the price near the upper band indicating potential overbought conditions.
- Momentum: The RSI shows a bullish trend but is not yet at extreme levels. The MACD indicates potential bearish momentum, suggesting caution.
Trading plan:
Entry strategy:
- Long position: If the price breaks above a recent high (e.g., 1.0970) with strong trading volume, it might signal continued upward momentum. Entering a long position at this point can capitalize on this potential continuation.
- Short position: If the price falls below the EMA (1.0932) or if the MACD shows a bearish crossover (MACD line crossing below the signal line), it may be a signal to enter a short position, anticipating a potential price decline.
Stop-loss:
- For long positions: Setting a stop-loss below the EMA (around 1.0920) helps limit potential losses if the price moves against the position.
- For short positions: Setting a stop-loss above the upper Bollinger Band (around 1.0975) helps protect against losses if the price increases instead of declining.
NOTE: Check out Forex risk management tools: automatic trading with popular market orders
Take-profit:
- For long positions: A take-profit target near the upper Bollinger Band (1.0970-1.1000) allows for capturing gains if the price continues to rise.
- For short positions: A take-profit target near the lower Bollinger Band (around 1.0894) enables capturing profits if the price declines as anticipated.
This detailed analysis uses multiple technical indicators to provide a snapshot of the EUR/USD currency pair. Each indicator offers insights into different aspects of market behavior—trend direction, volatility, momentum, and potential price reversals. However, this is just a guide to help you understand how to interpret these indicators. Always combine such analyses with additional research, and consider your risk tolerance before making trading decisions.
Top Forex brokers to trade EUR/USD
As we conclude our exploration of Forex trading, it’s time to highlight the best brokers for trading the EUR/USD pair. This pair’s popularity and liquidity make it essential to choose a broker that offers optimal conditions. Below, you’ll find our top picks, selected for their competitive spreads, reliable platforms, and excellent service. Use this list to find the broker that best suits your trading needs.
XTB FX trading
XTB is a solid choice for traders. As a top Forex and CFD broker, XTB operates in over 190 countries and is known for its reliability and transparency. It’s regulated by prominent authorities like the FCA, CySEC, and KNF.
With XTB, you can access a variety of trading options, including CFDs on forex pairs, indices, commodities, shares, and cryptocurrencies. You can trade NVIDIA stock through XTB’s user-friendly platforms, such as xStation and MetaTrader 4, which come with advanced tools to support your trading activities.
XTB caters to different trading styles with account types like Standard and swap-free accounts, each offering unique features and fee structures. Additionally, XTB offers valuable resources like daily market updates, economic calendars, and webinars to help you stay informed and make well-informed trading decisions.

Exness FX trading
Exness is a highly regarded Forex broker that offers a variety of trading options, including currency pairs, commodities, indices, and cryptocurrencies.
With regulation from leading authorities like the FCA in the UK and CySEC in Cyprus, Exness ensures a secure trading environment.
They provide competitive spreads across different account types, such as Standard and Professional, each with its own set of features.
Exness supports popular platforms like MetaTrader 4 (MT4) and MetaTrader 5 (MT5), known for their user-friendly interfaces and advanced charting tools. Plus, their customer support is accessible via email, live chat, and phone.
BlackBull FX trading
BlackBull Markets is a trusted Forex broker that offers a diverse range of trading options, including commodities, currency pairs, stocks, futures, indices, and cryptocurrencies.
Headquartered in Seychelles and regulated for safety, BlackBull provides various account types such as Standard, Prime, Institutional, and Islamic (swap-free), along with a demo account for practice.
They support several popular trading platforms, including MT4, MT5, cTrader, Web Trader, and TradingView. BlackBull also offers specialized tools like BlackBull CopyTrader and BlackBull Shares, and has mobile apps for trading on the go.
Additionally, BlackBull provides educational resources such as webinars and tutorials to help traders enhance their skills.
Plus500 FX trading
Plus500 is a well-established trading platform popular for CFD trading. CFDs let you speculate on financial asset prices without owning them directly.
In Asia, Plus500 is known for its user-friendly interface, wide range of tradable instruments, and strong regulatory compliance. You can trade CFDs on stocks, indices, commodities, cryptocurrencies, and Forex pairs, offering opportunities to build diverse portfolios.
The platform is easy to use, making it accessible for both beginners and experienced traders, and includes a demo account for risk-free practice. Plus500 operates under the oversight of reputable financial authorities in several Asian countries, ensuring a secure trading environment.
With competitive spreads and leverage options, Plus500 helps traders maximize potential returns, though it’s important to understand the risks of leverage. The platform also offers multilingual customer support and various deposit and withdrawal methods tailored to Asian users.

82% of retail investor accounts lose money when trading CFDs with this provider. You should consider whether you can afford to take the high risk of losing your money.
NAGA Markets FX trading
NAGA Markets is a respected global brokerage offering over 1,000 instruments, including currency pairs, stocks, indices, commodities, and ETFs. This variety supports diverse and growing portfolios.
For beginners and those interested in automated trading, NAGA features the NAGA Autocopy tool, which lets users replicate the strategies of successful traders, helping them improve their skills and gain insights.
NAGA also provides various trading aids and educational resources to enhance trading efficiency and security, ensuring well-informed decision-making.
Regulated by CySEC in Cyprus and compliant with MiFID in the European Economic Area, NAGA operates with full regulatory oversight as an authorized broker.

Related articles:
Analyzing EUR/USD - FAQ