Master USD/JPY trading: essential strategies, predictions, and Top FX brokers
Trading the USD/JPY can be tricky, whether you’re new to Forex or a seasoned pro. This article will simplify things by breaking down the essential indicators, charting techniques, and expert strategies for trading this major currency pair. We’ll cover how to understand price movements, momentum, trends, and volatility, so you can make smarter trading decisions. Plus, we’ll point you toward some of the best FX brokers for trading USD/JPY, offering competitive spreads and reliable platforms.
A detailed explanation of the USD/JPY chart analysis
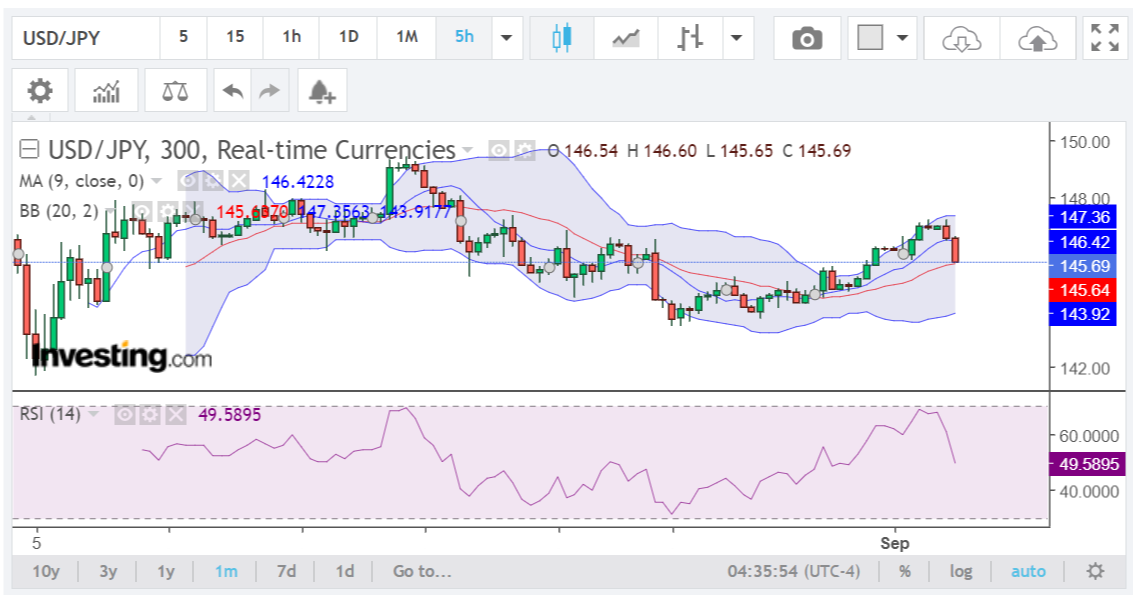
Note: The real chart shown here is taken from the Investing.com website. This analysis is provided purely as a guide for beginners on analyzing charts and is not a trading recommendation.
Analysis of the USD/JPY chart
1. Moving Average (MA) – red line
- Indicator: A 9-period moving average (MA) is shown on the chart.
- Color: Red.
- Analysis: The 9-period MA is trending relatively sideways with a slight upward slope. This indicates that while there is some upward momentum in the short term, it is not very strong. The price is hovering around this moving average, suggesting indecision in the market. When the price is above the moving average, it is typically considered a bullish sign, and when it is below, it is considered bearish.
Pro tip: Check out how to use Moving Averages in CFD trading.
2. Bollinger Bands (BB) – blue lines
- Indicator: Bollinger Bands (BB) with a period of 20 and a standard deviation of 2.
- Color: Blue (with a shaded area between the upper and lower bands).
- Analysis: Bollinger Bands are used to measure volatility. The bands are relatively wide, indicating higher volatility. The price has recently touched the upper band, which could signal an overbought condition. Following that, there is a pullback towards the middle band (which coincides with the moving average). If the price stays within the bands, it suggests consolidation, but a break above or below could signal the start of a new trend. The upper and lower bands act as dynamic resistance and support levels, respectively.
3. Relative Strength Index (RSI) – purple line
- Indicator: RSI with a period of 14.
- Color: Purple.
- Analysis: The RSI value is around 49.59, which is close to the midpoint (50). The RSI is neither in overbought (above 70) nor oversold (below 30) territory, indicating neutral momentum. However, it is trending downward, suggesting weakening bullish momentum or a potential shift to bearish momentum if the RSI continues to decline.
Trend analysis
- The price action shows a recent uptrend, as indicated by the higher highs and higher lows. However, the recent pullback suggests a potential correction or consolidation phase.
The price is hovering around the 9-period moving average, indicating uncertainty about the future direction. The sideways movement of the moving average also supports this view.
Momentum analysis
- The RSI is near 50, indicating a lack of strong momentum in either direction. The downward slope of the RSI suggests the bullish momentum is weakening, but there is not yet a clear indication of a bearish trend.
Volatility analysis
- The Bollinger Bands are relatively wide, indicating increased volatility. The recent touch of the upper band followed by a pullback towards the middle band suggests that the price might be entering a consolidation phase. If the bands start to narrow, it could indicate reduced volatility and a potential breakout in the near future.
USD/JPY predictions and trading plan
Neutral to Bullish scenario:
- If the price stays above the middle Bollinger Band (around 145.69) and the moving average starts to slope upwards again, it could signal a continuation of the bullish trend. Traders might consider a long position above the recent high (around 146.60), targeting the upper Bollinger Band (around 147.36) with a stop loss below the middle band (145.69).
More about bulls and bears in the Forex market.
Bearish scenario:
- If the price breaks below the middle Bollinger Band and the moving average slopes downward, it could signal a bearish trend. In this case, traders might consider short positions below 145.50, targeting the lower Bollinger Band (around 143.92) with a stop loss above the middle band (145.69).
Consolidation scenario:
- If the price remains between the middle and upper Bollinger Bands, it could indicate a period of consolidation. During this phase, traders may prefer to wait for a clearer breakout above or below the bands before entering a position.
The chart shows mixed signals with neutral momentum and high volatility. A clear trend direction has not yet been established, so traders should be cautious and wait for confirmation from the price action before making any trading decisions. Monitoring the behavior around key support and resistance levels and the RSI’s movement could provide additional insights.
Remember, this analysis is only a guide for beginners on analyzing charts and should not be taken as financial advice or a specific recommendation for trading. Always perform your own analysis and consult with a financial advisor before making any investment decisions.
Top Forex brokers to trade USD/JPY
Choosing the right broker is key to successful forex trading. After understanding the ins and outs of USD/JPY and various strategies, the next step is picking a reliable platform for your trades. We’ve put together a list of Top FX brokers known for excellent conditions for USD/JPY trading. These brokers offer low spreads, advanced tools, and strong regulation. Whether you care about low fees, quick execution, or an easy-to-use interface, these options cater to different trading needs and preferences.
Pro tip: Before choosing a Forex broker, check Forex brokers with the best reputation among real traders.
XTB USD/JPY trading
Looking to trade USD/JPY? Here’s why XTB stands out:
- Global reach: Active in 190+ countries with strong security and transparency.
- Regulated: Supervised by FCA, CySEC, and KNF.
- Versatile platforms: Trade USD/JPY and more on xStation and MetaTrader 4 with advanced tools.
- Flexible accounts: Options include Standard and swap-free accounts.
- Valuable resources: Enjoy daily market updates, economic calendars, and informative webinars.
Discover XTB and see how it can enhance your trading experience!

Exness USD/JPY trading
Here’s why Exness is worth checking out:
- Diverse options: Trade USD/JPY along with currency pairs, commodities, indices, and cryptocurrencies.
- Regulated: Overseen by FCA (UK) and CySEC (Cyprus) for a secure trading experience.
- Competitive spreads: Available through Standard and Professional accounts, each with unique benefits.
- Support: Access help via email, live chat, or phone.
- Platforms: Use MetaTrader 4 (MT4) and MetaTrader 5 (MT5) for intuitive trading and advanced charting tools.
Explore Exness for a robust trading experience!
BlackBull USD/JPY trading
Check out BlackBull Markets:
- Wide range: Trade USD/JPY along with commodities, currencies, stocks, futures, indices, and cryptocurrencies.
- Regulated: Overseen in Seychelles for a secure trading environment.
- Flexible accounts: Options include Standard, Prime, Institutional, Islamic (swap-free), and a demo account.
- Platforms: Access MT4, MT5, cTrader, Web Trader, TradingView, and mobile apps.
- Tools: Use BlackBull CopyTrader and BlackBull Shares for enhanced trading.
- Education: Benefit from webinars and tutorials to improve your skills.
eToro USD/JPY trading
Want to trade USD/JPY? Here’s why eToro stands out:
- Easy-to-use platform: Enjoy a user-friendly interface with advanced charting tools.
- Social trading: Follow and copy the trades of experienced investors.
- Zero commission: Trade USD/JPY without extra fees.
- Regulated: Operates under strong regulatory oversight.
- CopyPortfolios: Access professionally managed portfolios that include USD/JPY strategies.
To start, sign up, verify your identity, deposit funds, and trade USD/JPY with ease.
Risk disclaimer: eToro is a multi-asset platform which offers both investing in stocks and cryptoassets, as well as trading CFDs.
CFDs are complex instruments and come with a high risk of losing money rapidly due to leverage. 61% of retail investor accounts lose money when trading CFDs with this provider. You should consider whether you understand how CFDs work, and whether you can afford to take the high risk of losing your money.
This communication is intended for information and educational purposes only and should not be considered investment advice or investment recommendation. Past performance is not an indication of future results.
Copy Trading does not amount to investment advice. The value of your investments may go up or down. Your capital is at risk.
Don’t invest unless you’re prepared to lose all the money you invest. This is a high-risk investment and you should not expect to be protected if something goes wrong. Take 2 mins to learn more.
eToro USA LLC does not offer CFDs and makes no representation and assumes no liability as to the accuracy or completeness of the content of this publication, which has been prepared by our partner utilizing publicly available non-entity specific information about eToro.
OANDA USD/JPY trading
Here’s why OANDA is a solid choice:
- Trusted broker: Established in 1996 with a strong reputation for reliability.
- Competitive spreads: Benefit from low spreads and flexible leverage.
- Platform options: Trade USD/JPY on MetaTrader 4 or OANDA’s own platform with advanced charting tools.
- Comprehensive tools: Access daily market analysis, forex news, and expert commentary.
Enjoy a secure trading environment and a range of resources to enhance your USD/JPY trading experience.
Related articles:
How to analyze USD/JPY - FAQ