A guide to analyzing NVDA stock: key indicators and chart analysis
Navigating the stock market can be challenging, but you can make informed trading decisions with the right tools and analysis. In this article, we delve into the Technical analysis of NVIDIA Corporation (NVDA) stock, using key indicators such as the Simple Moving Average (SMA), Relative Strength Index (RSI), and Moving Average Convergence Divergence (MACD). We’ll break down these elements to comprehensively understand the stock’s current performance and offer insights into potential future movements. This guide aims to equip you with the knowledge to analyze stock charts effectively, enabling you to make strategic investment choices.
NVDA stock analysis: key indicators, entry & exit points
NVIDIA Corporation (NVDA) has become a standout performer in the fast-evolving world of stock trading, attracting investors with its robust performance and significant market presence. This article provides a concise analysis of NVIDIA’s stock using key indicators such as the Simple Moving Average (SMA), trading volume, the Relative Strength Index (RSI), and MACD. We’ll guide you through interpreting these indicators and discussing potential entry and exit points, stop-loss strategies, and market predictions. This is not a recommendation, but a comprehensive guide to help you better understand NVIDIA’s stock and enhance your trading decisions.
NVDA stock chart analysis
Price movement
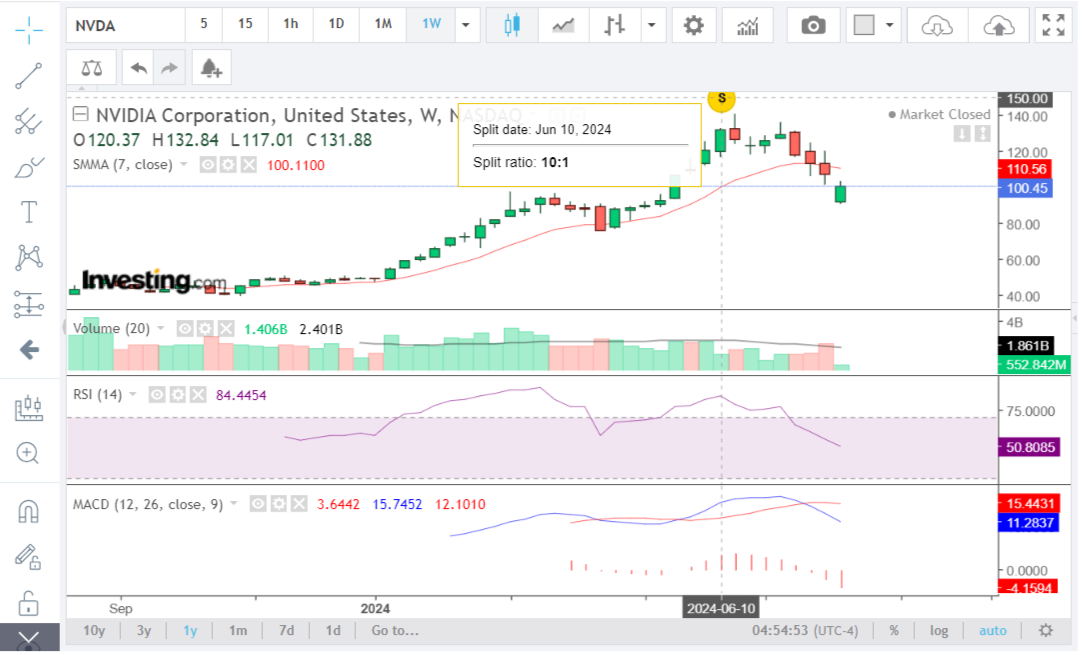
- Current price: $131.88
- Weekly range: The stock price fluctuated between $117.01 and $132.84 this week.
- The price movement of a stock provides insight into the stock’s performance over a specific period. The current price, weekly range, and historical trends help traders understand the stock’s behavior and potential future movements. NVIDIA’s current price of $131.88, along with its weekly range, indicates significant fluctuations. The historical trend shows a strong upward movement since late 2023, which slowed down after the stock split in June 2024.
Stock split
- Split date: June 10, 2024
- Split ratio: 10:1
- A stock split increases the number of shares available by splitting each share into multiple shares. For NVIDIA, the 10:1 split on June 10, 2024, means each share was divided into ten new shares. This often increases liquidity and makes the stock more affordable to investors. However, it can also cause temporary volatility as the market adjusts to the new share structure.
Simple moving average (SMA)
- 7-period SMA (red line): Currently at $100.11
- The Simple Moving Average (SMA) is a widely used indicator in technical analysis. It smooths out price data by averaging the stock prices over a specific period, providing a clear trend direction. For NVIDIA, the 7-period SMA at $100.11 shows a bullish trend as the current price is well above the SMA. However, a recent dip in price suggests a potential correction.
Volume
- Average volume: Around 2.401 billion shares
- Current volume: 1.861 billion shares
- Trading volume indicates the number of shares traded during a specific period. High trading volume often accompanies significant price movements and provides insight into market sentiment. NVIDIA’s average volume of 2.401 billion shares compared to the current volume of 1.861 billion shares suggests decreased trading activity, which could be a sign of reduced interest or impending price movement.
Relative Strength Index (RSI)
- Current RSI: 84.45
- The Relative Strength Index (RSI) measures the speed and change of price movements, typically over a 14-day period. It ranges from 0 to 100, with values above 70 indicating overbought conditions and values below 30 indicating oversold conditions. NVIDIA’s current RSI of 84.45 suggests the stock is overbought, often preceding a pullback or consolidation phase.
Moving Average Convergence Divergence (MACD)
- MACD line (blue): 15.75
- Signal line (red): 12.10
- MACD histogram: -3.644
- The Moving Average Convergence Divergence (MACD) is a momentum indicator that shows the relationship between two moving averages of a stock’s price. The MACD line (blue) above the signal line (red) typically indicates bullish momentum. However, the decreasing MACD histogram (-3.644) suggests weakening bullish momentum and potential slowing down or reversal.
NVDA stock predictions and trading plan
Predictions:
- Short-term prediction (1-2 weeks): Given the high RSI and the decreasing MACD histogram, expect some consolidation or a minor pullback. The stock may retest lower support levels before making any significant upward moves.
- Medium-term prediction (1-3 months): If the stock price remains above the 7-period SMA, the bullish trend could continue. Watch for a breakout above the recent high of $132.84, which would signal a continuation of the uptrend.
- Long-term prediction (6+ months): Provided that market conditions are favorable and NVIDIA continues its strong performance, the stock could resume its upward trajectory after this consolidation phase.
Trading plan:
- Entry point: Consider entering the market if the stock price pulls back towards the 7-period SMA (around $100.11) and shows signs of bouncing back with increased volume. This level can serve as a potential entry point.
- Stop loss: To manage risk, place a stop loss just below the recent low of $117.01. This minimizes potential losses if the stock reverses its trend.
NOTE: Check out Forex risk management tools: automatic trading with popular market orders
- Take profit: Set an initial profit target at the recent high of $132.84. If the stock breaks above this level with strong volume, consider holding for a higher target, as this could indicate the continuation of the uptrend.
- Monitoring: Continuously monitor the RSI to ensure it stays above 50, indicating sustained bullish momentum.
Watch for any bearish crossover in the MACD (i.e., the MACD line crossing below the signal line), which could signal a trend reversal.
Keep an eye on trading volume to confirm the strength of price movements. High volume on upward movements reinforces bullish trends, while high volume on downward movements indicates selling pressure.
NOTE: This analysis is provided for educational purposes only and should not be construed as financial advice. Always conduct your own research or consult with a certified financial advisor before making any investment decisions.
Top Forex brokers to trade NVDA stock
If you’re looking to trade NVIDIA Corporation (NVDA) stock in the Forex market, choosing the right broker is essential. A good Forex broker will provide you with the platforms and tools needed to manage your trades effectively. To help you find the best fit for your trading needs, we’ve compiled a list of top Forex brokers that offer excellent access to NVIDIA stock. Explore these options to ensure you have the resources and support you need.
XTB FX trading
When you’re ready to trade NVIDIA (NVDA) stock, XTB is a great option. As a leading Forex and CFD broker, XTB operates in over 190 countries and is known for its security and transparency. It’s regulated by major authorities like the FCA, CySEC, and KNF.
XTB offers a wide range of trading options, including CFDs on forex pairs, indices, commodities, shares, and cryptocurrencies. You can trade NVIDIA stock using XTB’s easy-to-use platforms, like xStation and MetaTrader 4, which provide advanced tools to help with your trades.
XTB supports different trading styles with account types such as Standard and swap-free accounts, each with its own features and fee structures. Plus, XTB provides valuable research and analysis resources, including daily market updates, economic calendars, and webinars, to help you stay informed and make smart trading decisions.

Exness FX trading
Exness is a well-regarded Forex broker offering a range of trading options, including currency pairs, commodities, indices, and cryptocurrencies.
Regulated by top authorities like the FCA in the UK and CySEC in Cyprus, Exness provides a secure trading environment.
They offer competitive spreads with different account types, such as Standard and Professional, each with its own features.
Exness supports popular platforms like MetaTrader 4 (MT4) and MetaTrader 5 (MT5), known for their ease of use and advanced charting tools. Customer support is available via email, live chat, and phone.
BlackBull FX trading
BlackBull Markets is a reliable Forex broker with a wide range of trading options, including commodities, currency pairs, stocks, futures, indices, and cryptocurrencies.
Based in Seychelles and regulated for safety, BlackBull offers various account types, such as standard, prime, institutional, and Islamic (swap-free), plus a demo account for practice.
They provide several popular trading platforms, including MT4, MT5, cTrader, Web Trader, and TradingView. BlackBull also has special tools like BlackBull CopyTrader and BlackBull Shares, and mobile apps for trading on the go.
Additionally, BlackBull offers educational resources like webinars and tutorials to help traders improve their skills.
eToro FX trading
eToro, founded in 2007, has made online trading accessible and engaging for a global audience. It offers a user-friendly platform with innovative features like social trading, where you can follow and copy the trades of experienced investors.
For trading NVIDIA (NVDA) stocks, eToro provides valuable tools and conditions. You can connect with and replicate the strategies of other traders, trade without extra fees, and use a platform that’s easy to navigate with advanced charting tools. eToro also offers CopyPortfolios, which let you invest in professionally managed asset portfolios, including stocks like NVIDIA. The platform is regulated by multiple financial authorities, ensuring a secure trading environment.
To start trading on eToro, simply sign up and verify your identity. Then, deposit funds using various methods. Search for NVIDIA (NVDA) stocks on the platform, set your trade parameters, and execute your trades.
Risk disclaimer: eToro is a multi-asset platform which offers both investing in stocks and cryptoassets, as well as trading CFDs.
CFDs are complex instruments and come with a high risk of losing money rapidly due to leverage. 51% of retail investor accounts lose money when trading CFDs with this provider. You should consider whether you understand how CFDs work, and whether you can afford to take the high risk of losing your money.
This communication is intended for information and educational purposes only and should not be considered investment advice or investment recommendation. Past performance is not an indication of future results.
Copy Trading does not amount to investment advice. The value of your investments may go up or down. Your capital is at risk.
Don’t invest unless you’re prepared to lose all the money you invest. This is a high-risk investment and you should not expect to be protected if something goes wrong. Take 2 mins to learn more.
eToro USA LLC does not offer CFDs and makes no representation and assumes no liability as to the accuracy or completeness of the content of this publication, which has been prepared by our partner utilizing publicly available non-entity specific information about eToro.
AvaTrade FX trading
AvaTrade, established in 2006, is a respected Forex broker with a global presence, serving over 300,000 clients. With strong regulation from bodies like the Central Bank of Ireland, ASIC, and the FSC of the British Virgin Islands, AvaTrade is known for its reliability and customer focus.
When trading NVIDIA (NVDA) stocks, AvaTrade offers several advantages. You can choose from various account types, such as Standard, Gold, Platinum, and VIP, to match your trading needs. AvaTrade provides competitive spreads on NVIDIA stocks, helping to keep your trading costs low. The broker offers flexible leverage options, allowing you to manage larger positions with a smaller amount of capital, though it’s important to use leverage wisely.
AvaTrade supports advanced trading through platforms like MT4 and MT5, which feature robust charting tools and fast execution speeds. To help you manage risks, AvaTrade offers tools like stop-loss and take-profit orders. Additionally, AvaTrade provides a range of educational resources, including webinars and market analysis, to support your trading and keep you informed about market movements affecting NVIDIA stocks.
Related articles:
NVIDIA stock analysis - FAQ