Alphabet Inc. (GOOGL) stock: key indicators, expert techniques, and Top brokers to trade

Alphabet Inc. (GOOGL) is one of the most significant tech stocks, drawing interest from both long-term investors and short-term traders. To effectively analyze its stock, it’s important to understand technical indicators and market trends. In this article, we’ll cover key tools like Exponential Moving Averages (EMA), Bollinger Bands, and the Relative Strength Index (RSI) to track GOOGL’s price movements. We’ll also discuss chart techniques and trading strategies to help you make informed decisions.
A detailed Alphabet Inc. (GOOGL) stock chart analysis

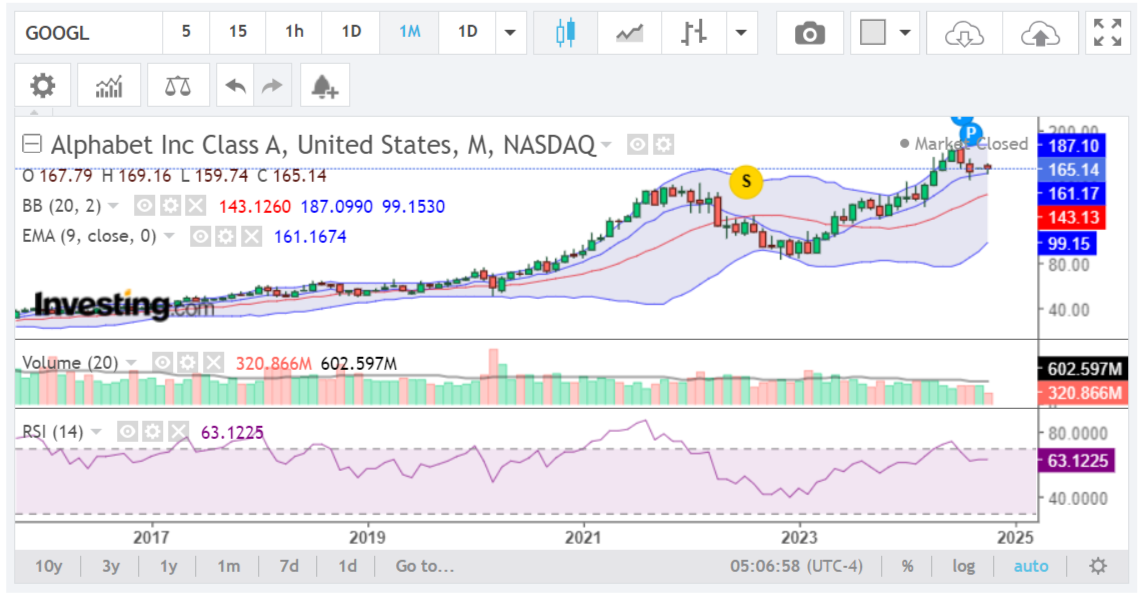
The real chart of Alphabet Inc. (GOOGL) stock shown here is sourced from the investing.com website. Please note, this is not a recommendation, but rather a guide for beginners on how to analyze stock charts, including technical indicators, trend analysis, momentum, and volatility.
Time period, candlestick patterns, and indicators of Alphabet Inc. (GOOGL) stock chart
Time period
- Monthly (M): The chart represents the price movement of GOOGL over the course of multiple years. The last price point shows October 2024.
Indicators:
Bollinger Bands (BB, 20, 2):
- Color: The upper band is blue (187.0990), the middle band (20-period moving average) is red (143.1260), and the lower band is blue (99.1530).
- Purpose: Bollinger Bands help measure volatility. The price is near the upper band, which often suggests the stock is overbought, potentially signaling a pullback. Wider bands indicate increased volatility.
Exponential Moving Average (EMA, 9-period):
- Color: Blue (161.1674).
- Purpose: The EMA places more emphasis on recent prices and helps gauge momentum. The stock is currently slightly above the EMA, which is a bullish sign, but the price is nearing a support test level.
→More about how to use Moving Averages in CFD trading.
Relative Strength Index (RSI, 14):
- Color: Purple (63.1225).
- Purpose: RSI measures market momentum and indicates overbought (above 70) or oversold (below 30) conditions. With a current RSI of 63.12, the stock shows bullish momentum but is approaching overbought levels, suggesting caution.
Volume (20-period moving average):
- The volume comparison shows the last month’s trading volume at 320.866M, which is below the average of 602.597M. This suggests less conviction in either buying or selling pressure at the moment.
Candlestick patterns:
- The monthly candlestick patterns can provide additional context. The current candlestick shows a long wick on top, indicating potential selling pressure as the stock tested higher prices but closed lower. This could signal a possible reversal if selling pressure continues, especially near resistance at $187.
For newbies: Understanding Japanese candlestick charts: basic figures and main patterns
Trend analysis:
- Long-term trend: GOOGL’s long-term trend has been bullish, with steady gains since early 2020. The stock continues to make higher highs and higher lows, indicating a strong upward trajectory.
- Short-term trend: In the short term, the stock is nearing key resistance levels at $187, which could result in consolidation or a minor pullback if the price fails to break through.
Momentum:
- Momentum is positive as the stock trades above the EMA and the RSI remains in bullish territory. However, with the RSI nearing overbought levels, the upward momentum may slow, signaling a period of consolidation.
Volatility:
- The relatively wide Bollinger Bands suggest heightened volatility, meaning that the stock could experience sharp price swings. This volatility is typical after extended bullish runs and may precede either further upward movement or a short-term correction.
Price prediction and trading plan of Alphabet Inc. (GOOGL) stock
Price prediction:
- Bullish scenario: If the price can break above the $187 resistance level (upper Bollinger Band), it may continue to rally toward new highs.
- Bearish scenario: If the price fails to break resistance and falls below the EMA ($161), a deeper correction may occur. The middle Bollinger Band ($143) could serve as a key support level in this scenario.
Trading plan (for learning purposes):
- Bullish plan: A close above $187 on strong volume could signal continued upward movement. In this case, a long position might be considered, with a stop-loss set just below the EMA at $161.
- Bearish plan: If the price drops below $161, a short-term correction may be underway. Waiting for the price to approach the middle Bollinger Band ($143) might offer a better entry point for a long-term position.
→Additional details regarding bulls and bears in the Forex market.
Alphabet Inc. (GOOGL) stock is in a long-term bullish trend, but it is approaching overbought conditions and significant resistance at $187. A break above this level could lead to new highs, while a pullback to $161 or $143 may provide better entry points for long-term investors. Always use stop-losses to manage risk, and keep monitoring key indicators like volatility and momentum for more informed decisions.
This analysis is meant as a learning tool for beginners to understand how to interpret technical indicators but is not financial advice or a trading recommendation. Always do your own research before making any financial decisions.
Top Forex brokers to trade Alphabet Inc. (GOOGL) stock
Now that you’ve learned how to analyze Alphabet Inc. (GOOGL) stock using key indicators and expert trading techniques, the next step is choosing a reliable broker to execute your trades. Trading GOOGL stock requires access to platforms that offer competitive spreads, fast execution, and powerful trading tools. Below, we’ve curated a list of the top FX brokers that specialize in stock and CFD trading, allowing you to make the most of your GOOGL trades. Whether you’re focused on technical analysis, automated trading, or security, these brokers offer the features you need to trade with confidence.
Just a reminder: Before signing up with a Forex broker, check Forex brokers with the best reputation among real traders.
XTB Google stock trading
XTB is a leading broker with a strong global reach, operating in over 190 countries while providing top-notch security and transparency. Regulated by respected authorities such as the FCA, CySEC, and KNF, it offers traders a high level of trust and oversight. With versatile trading platforms like xStation and MetaTrader 4, XTB equips users with advanced tools to trade not only currency pairs but also stocks like GOOGL.US (Alphabet Inc. Class A). The broker offers flexible account options, including Standard and swap-free accounts, to suit various trading preferences and strategies.
Plus500 Google stock trading
Plus500 is a well-established online trading platform that specializes in Contract for Difference (CFD) trading, allowing traders to speculate on price movements of Alphabet (GOOG) stock without having to own the actual shares. The platform features a user-friendly interface and offers a diverse range of CFDs, including stocks, indices, commodities, cryptocurrencies, and Forex pairs, enabling traders to build a varied portfolio and access multiple markets. With Plus500, traders can engage in trading Alphabet stock CFDs, enhancing their investment opportunities. The platform is designed for both novice and experienced traders, providing a demo account for risk-free practice. Plus500 is regulated by reputable financial authorities, ensuring a secure and transparent trading environment.
82% of retail investor accounts lose money when trading CFDs with this provider. You should consider whether you can afford to take the high risk of losing your money.
BlackBull Google stock trading
BlackBull Markets provides a diverse array of trading options, including commodities, currencies, stocks, futures, indices, and cryptocurrencies, ensuring a secure trading environment as a regulated broker in Seychelles. Traders can select from various account types—Standard, Prime, Institutional, Islamic (swap-free), and a demo account—tailored to their specific needs. The platform supports multiple trading interfaces, such as MT4, MT5, cTrader, Web Trader, TradingView, and mobile apps. Additionally, BlackBull Markets offers valuable tools like BlackBull CopyTrader and BlackBull Shares, along with educational resources including webinars and tutorials to help traders enhance their skills. Traders can also engage in trading Alphabet Inc. Class C (GOOG) stock CFDs, expanding their investment opportunities within the tech sector.
OANDA Google stock trading
OANDA is a reputable online broker celebrated for its reliability and outstanding customer service, offering a secure trading environment with competitive spreads and customizable leverage options that cater to individual trading strategies and risk profiles. Users can access popular platforms like MetaTrader 4 and OANDA’s own platform, OANDA Trade, which includes advanced charting tools and expert advisors to facilitate technical analysis and algorithmic trading. The broker also provides a comprehensive range of resources, including daily and weekly market analysis, Forex news, and expert commentary to enhance the trading experience. Additionally, OANDA enables traders to engage in CFDs for Alphabet Inc. (GOOGL) shares, expanding their investment possibilities in the technology sector.
XM Google stock trading
XM Group, founded in 2009 and headquartered in Belize, is a dependable online broker specializing in Forex and CFD trading, offering a low minimum deposit requirement. Regulated by respected authorities like the Cyprus Securities and Exchange Commission (CySEC) and the UK’s Financial Conduct Authority (FCA), XM Group guarantees a secure trading environment, enhancing account security through features such as two-step authentication. The broker provides a broad range of trading options, including currency pairs, stocks, commodities, and indices, facilitating market exploration and portfolio diversification. Designed for both novice and experienced traders, the user-friendly platform includes various tools and resources. With competitive spreads and multiple account types, XM Group caters to diverse trading preferences, whether you’re starting with a demo account or seeking advanced capabilities. Besides, XM Group enables traders to access Google (GOOG.OQ) stocks as cash CFDs, allowing for strategic investments in one of the world’s leading technology companies.
Related articles:
Alphabet (GOOGL) stock chart analysis - FAQ