Japanese candlesticks in Forex trading: how to use them for market analysis
In all financial markets, the price of any asset is shown in the form of charts that constantly change during the trading session depending on supply and demand. To predict the future direction of price movement, one of the most popular techniques is candlestick analysis, which is based on such a concept as Japanese candlesticks.
Japanese candlesticks are a type of price line, as well as a type of interval chart, which is used to graphically display fluctuations in quotations of securities, currencies, derivatives, energy, commodities, and other assets. The candlestick chart is one of the most popular components of technical analysis, allowing traders to quickly and easily interpret price information from multiple price bars.
Different types of candlesticks allow the trader to determine the position of bulls and bears. Movements on the chart form typical combinations (patterns) by which a trader can predict further price behavior. There are so many candlestick patterns that indicate market opportunities – some give an idea of the balance between buying and selling pressure, while others identify continuation patterns or market hesitation.
What do Japanese candlesticks show on the chart?
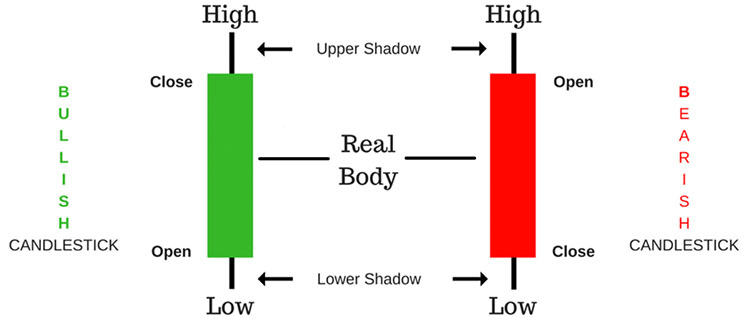
A candle has three main parameters:
- The body of the candle represents the open-close range.
- Shadow indicates the daily high and low.
- The color that shows the direction of the market – a green (or white) body indicates an increase in price, and a red (or black) body indicates a decrease in price.
On each timeframe, any candle always displays the same information:
- Price minimum for the period (Low);
- Price maximum for the period (High);
- Period opening price (Open);
- Period closing price (Close).
The open and close marks are the frame of the candle, and the band up or down from the body of the candle is called its shadow.
The body of a standard bearish candlestick, that is, one with a close below the open, is colored black or red. The body of a bullish candle closes above the open, white, or green.
Sometimes the body of the candlestick is missing. This happens when the period was opened and closed at the same price. Such candlesticks are called Doji. It is also common to see candlesticks with missing shadows. This means that the prices at the opening and closing of the period were their maximum and minimum.
The essence of candlestick analysis comes down to one goal – to find some combinations of candlesticks that are similar to each other, which are periodically found on price charts. Such combinations are called patterns (models) of Japanese candlesticks, which can be represented by 1-3 candles or more. Quite a lot of such patterns have been identified, and each of them has an original name, for example, “Evening Star”, “Abandoned Baby”, “Hammer”, “Harami” and others.
Each model has its own special meaning and signals the trader about some market changes that can be used to open transactions.
Japanese candlestick patterns are divided into two types according to the nature of the signals:
- Trend reversal combinations.
- Trend continuation combinations.
We also should keep in mind that the vast majority of patterns are reversal patterns.
Main Japanese candlestick figures in Forex trading
By candlesticks, traders can quickly assess the state of the market. Based on their shape and combinations, you can determine the current direction of the trend and the likelihood of a reversal. There are several candlestick figures in Forex trading charts that can form various combinations, namely:
- Long and short candlesticks in Forex trading
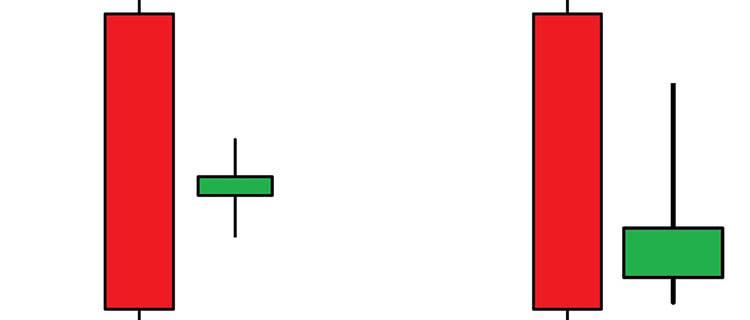
A long candlestick with a short shadow indicates that bulls or bears dominate at this stage (depending on the color of the candle). A short candlestick body is a sign that the struggle between sellers and buyers was almost equal.
- Marubozu in Forex trading
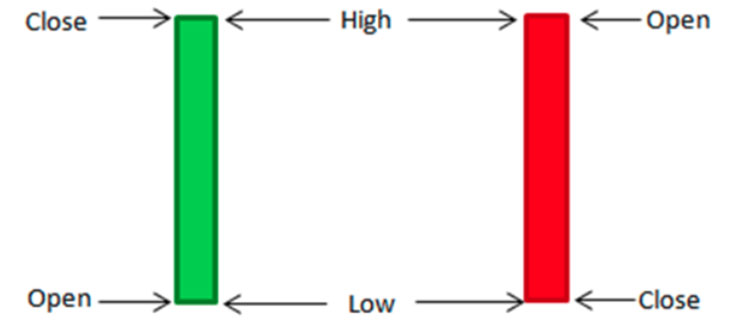
Marubozu is called a candlestick without shadows. The appearance of such a red or black candlestick indicates that the opening price of the position corresponded to its maximum, and the closing price to its minimum, that is, the bears won. A green or white Marubozu is a sign of the opposite, bullish situation.
- Doji in Forex trading
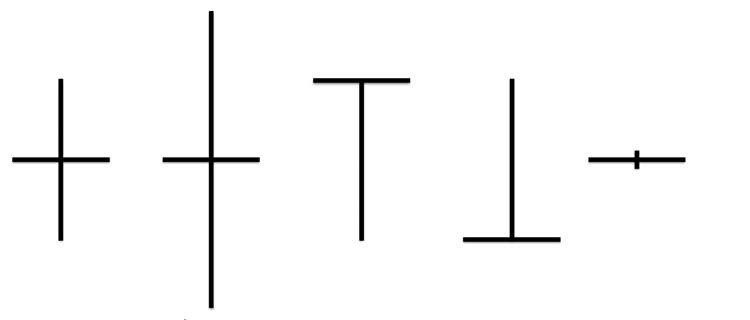
When a position is opened and closed at the same (or nearly the same) price, flat candles without a body appear on the chart. Depending on the length of the shadow, they can look like a cross or the letter T. A single Doji and any combination with it is a situation of uncertainty, in which, at the end of the trading session, there is no advantage for both sellers and buyers. The appearance of a Doji at the top or bottom of a trend is a sure sign that the situation is about to change. For example, when a Tombstone Doji appears on an uptrend, it makes sense to partially close a long position.
- Star in Forex charts

This is the name of a candlestick with a short body (or without a body, if it is a Doji), which appears at the very top or at the very bottom of the trend. Depending on the position of the star, there are formed certain combinations.
- Hammer (Pin Bar)/Hanged Man in Forex charts
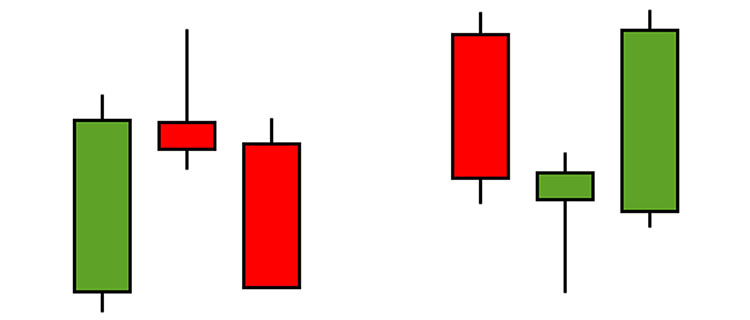
This pattern is characterized by a short candlestick body and twice as long lower shadow. The upper shadow is, as it were, cut off – it is short or completely absent. Depending on the trend in which the figure appeared, it is called a Hammer (downtrend) or a Hanging man (uptrend). Sometimes there is an inverted Hammer, but this does not change its properties. The color of the body of the candle also does not matter much. The appearance of a Hammer on the Japanese candlestick chart portends a reversal but needs to be confirmed by the next combination. The same can be said about the Hanged man. The long shadow (handle) of the Hammer indicates that there was a struggle between buyers and sellers, and the short body indicates that one of the parties won.
- A gap in Forex charts
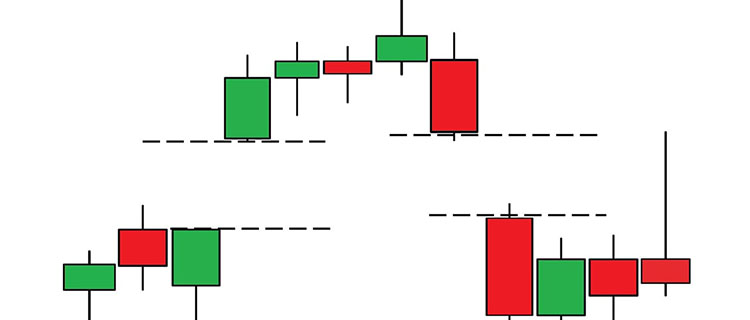
The term is used not only for reading Japanese candlesticks but also in other methods of graphical analysis. The gap may appear due to technical reasons or when the price changes sharply between trading sessions. The second option is the most interesting for traders.
Common Japanese candlestick combinations in Forex trading
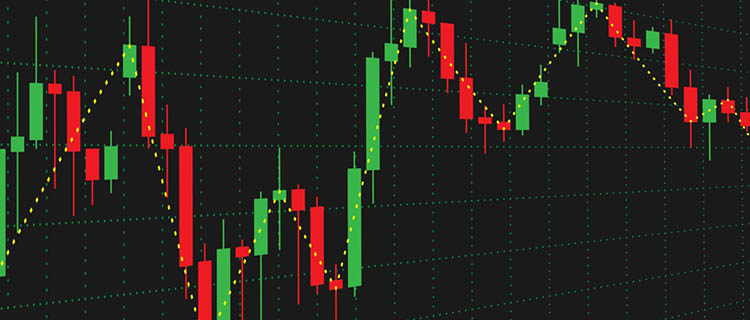
An analysis of individual Japanese candlesticks can already provide the trader with certain information and make it possible to forecast further price movement. But the analysis of candlestick combinations can bring even greater value, that is, it is the analysis of several Japanese candlesticks that form a certain typical combination.
Candlesticks combinations are models that, under certain conditions, can give a fairly accurate forecast of a change in the price trend. That is, they are always used as reversal signals.
Consider some of the most common candlesticks combinations:
- Morning and Evening Star in Forex trading
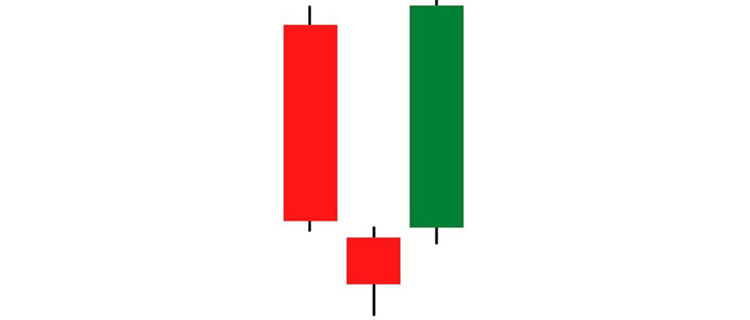
The Morning Star is a candle combination that indicates a bullish trend in the market. It is considered a reversal pattern that indicates a rise in price after a sustained downtrend.
The Morning Star candlestick structure starts with a relatively large bearish candle, followed by a smaller inside candlestick and the final third one, which is relatively large and bullish. The first candlestick in the structure confirms bearish sentiment within a downtrend, the second candlestick indicates indecision in the market, followed by the third candlestick, which confirms a potential upward price reversal. Thus, we see a bullish reversal pattern, which implies that the price should continue to rise after the completion of the Shooting Star pattern.
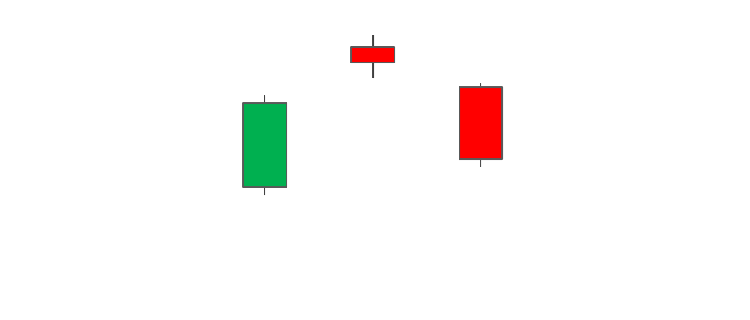
The opposite of the Morning Star is a signal of the victory of the bears. On the chart, this combination of Japanese candlesticks is always accompanied by gaps.
- Shooting Star in Forex charts
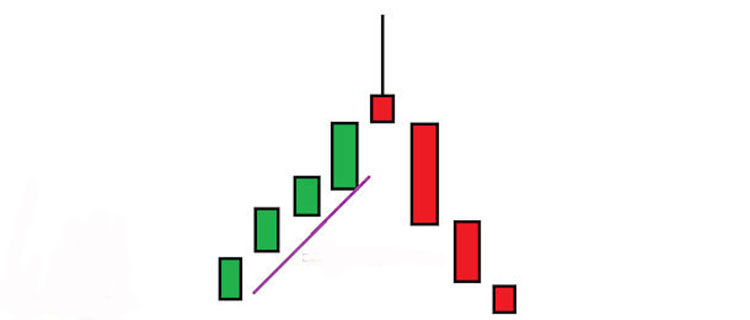
The Shooting Star pattern forms at the end of an uptrend. Before the Shooting Star, there should be a rise of the bulls, then a small upper window, and only then a fall. At the same time, the Shooting Star should show a local maximum of the asset price and be clearly higher than the previous candles.
- Engulfing in Forex trading
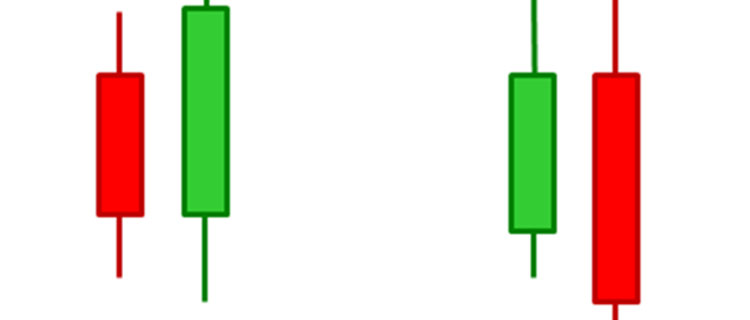
Engulfing consists of two adjacent candlesticks of different colors, where the body of the second candlestick completely covers the body of the previous one. If there are black and white (or red and green) candlesticks in this order, this means that a bullish engulfing has occurred – the bullish candlestick has won the bearish one, and now it has a lower opening price and a higher closing price. The reverse situation, when the second candlestick has a higher opening price and a lower closing price, is called bearish engulfing. This combination often appears on the chart and may indicate that the trend in the market is changing. To confirm a trend reversal, it is recommended to wait for the second candlestick to appear or use additional indicators.
- Harami in Forex trading
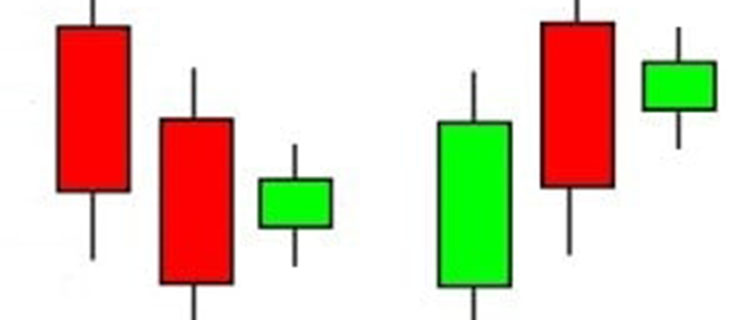
Harami is the opposite of Engulfing which occurs when a candlestick with a long body is followed by a short candlestick or Doji. In this case, the color of the candles is most often different. A variation of Harami with a Doji is called a Harami cross. The appearance of this combination in any form demonstrates a price gap and indicates a trend reversal in the opposite direction.
- Dark Cloud Cover or the Piercing patterns in Forex charts
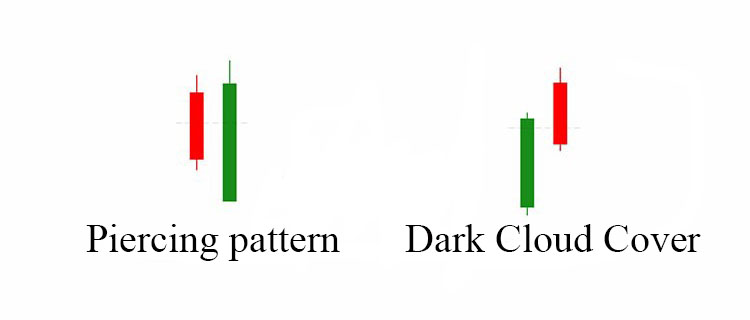
Piercing pattern and Dark Cloud Cover are reversal candlestick patterns that herald the beginning of a correction or a reversal of the current trend. These patterns consist of two candlesticks and are mirrored. The Piercing pattern is formed at the lows of the price chart and indicates a possible upward reversal. Dark Cloud Cover appears at the highs and warns about the beginning of a downward movement.
Figuratively speaking, the appearance of Dark Cloud Cover in a growing market suggests that the bulls have hit a serious resistance and, if they fail to overcome it, a downward correction will follow. And vice versa – the appearance after the market decline of the Piercing pattern indicates that the bears are losing the initiative and the bulls are full of optimism to turn the quotes up.
- Mat Hold in Forex trading
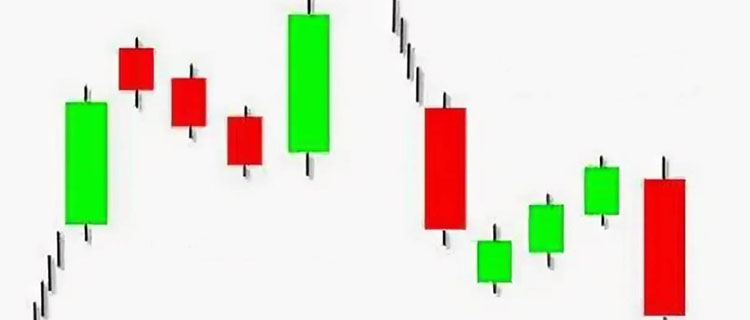
Mat Hold is a correction of three candles, the first candle opens with a gap, and the next two completely cover the gap. The fourth candle absorbs the previous ones and closes at a new high/low. As a rule, this candlesticks combination is formed in the middle of a trend and in some cases gives a false signal for a reversal.
- Tasuki Gap in Forex charts
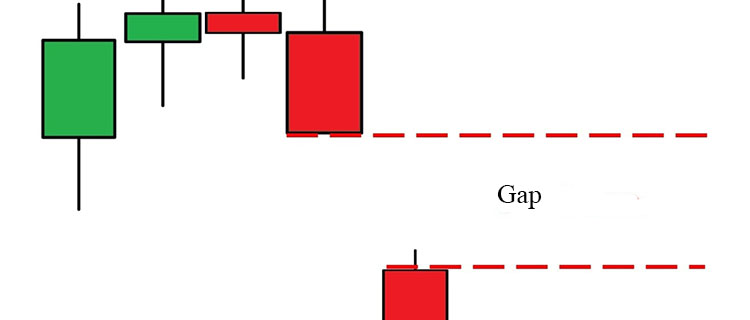
After the formation of a price gap, the price makes a slight correction of candles of the opposite color and partially covers the gap. The current trend continues.
- Three line strike in Forex charts
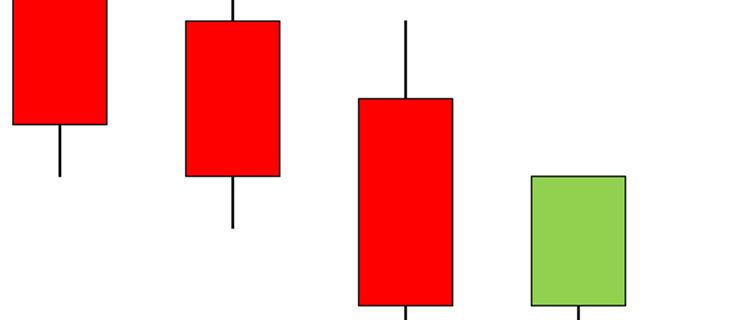
This candlesticks combination also consists of several candles. After a long directional movement, the price rolls back one large candlestick, which absorbs the three previous candlesticks with its body.
- Abandoned Baby in Forex trading
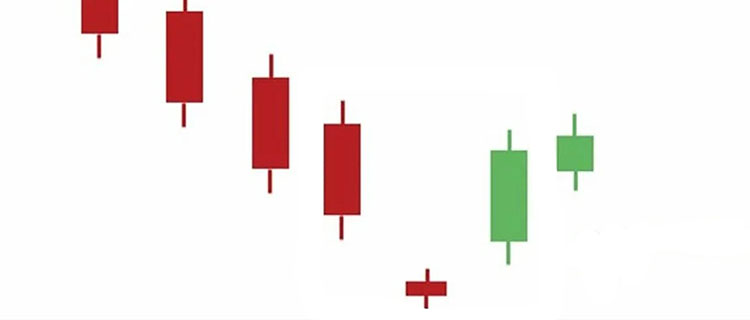
The Abandoned Baby is a Doji formed with a gap. The model will be strengthened by two conditions, the first candlestick before the Doji is growing, and the next after, the Doji is falling. On a downtrend, the opposite is true.
In fact, there are a huge number of patterns that are described in books devoted to market analysis using Japanese candlesticks. It is quite difficult to cover all candlestick combinations in one article, so we have given only a few main examples. Candlestick analysis in the financial markets has been used for a very long time and watching the charts, market participants make their conclusions, and perhaps they do not coincide with the observations that were made at the dawn of the analysis of Japanese candlesticks. On the one hand, Japanese candlesticks and their formations may seem quite complicated at first glance, but having understood the basics, it will become a powerful tool in your price movement forecasts.
Candlestick analysis features and opportunities in Forex trading

Japanese candlesticks are a technical tool for displaying the minimum and maximum price values within a given time period. For a trader, this is an extremely useful instrument because it allows you to view and analyze a large amount of market data in a convenient format. In addition, Japanese candlesticks have a number of advantages, namely:
- Informativeness. The main advantage of Japanese candlesticks over other methods of graphical analysis is the most detailed display of the market situation. The line chart shows only price levels, and the bar chart shows price levels + opening and closing points. Unlike them, the candlestick chart model also shows the positions of sellers (bears) and buyers (bulls).
- Relevance. In contrast to the tic-tac-toe chart, which is not tied to a timeline, the candlestick pattern allows the trader to notice the smallest changes in the market in real time.
- Visibility. The color coding of various indicators makes the Japanese candlestick chart more visual than other types of charts. Because of this property, the candlestick indicator is recommended for novice traders.
- Efficiency. Combined with other technical analysis methods such as trend lines, moving averages, and oscillators, Japanese candlesticks give the trader a complete picture of the market situation.
Tips for effective use of candlesticks in the Forex market
It is worth noting that the Japanese candlestick analysis method, like any other method, be it market analysis or economic and technical methods, has its own areas and limits of application, within which it works well and reliably. But if you violate them and apply the method where it is not efficient in advance, then you can quickly become disillusioned with it. Consider the criteria for the correct application of the Japanese candlesticks analysis.
- Large time intervals. It is on large time intervals (not less than a daily interval) that candlestick analysis works as correctly as possible. The shorter the time interval, the more fluctuation the price chart is with false speculative signals. Lost of studies of the Japanese candlestick analysis method show that it is most efficient on weekly price charts, and is also quite effectively applicable to daily and monthly intervals.
- The presence of a stable trend in the market, which should change. Since all candlestick combinations and individual Japanese candlesticks are aimed at finding a trend reversal point, in this case, it imposes the first and mandatory criterion that the trend should, first of all, exist in principle. This means that you don’t need to look for reversal candle combinations in a sideways trendless market. Reliable reversal patterns are formed precisely at the peaks of pronounced strong market trends.
- Accurate adherence to the graphic model. Visually, dozens and hundreds of similar candlestick combinations can be noted on the chart, but only a few are reliable. In this case, each combination has its own key model quality criteria. If they are not observed exactly, then the model is considered unreliable.
Copy trading in the Forex market

Almost every modern trader who relies on graphical market analysis uses Japanese candlesticks in his work. Candlesticks are an advanced tool for predicting the behavior of price charts, as well as helping to reveal the mood and psychology of the market. Using this tool, traders can improve their skills and become real professionals. But in addition to tool, in order to close effective transactions, many market participants, in particular beginners without deep knowledge or those who just want to save time, can use Copy trading features from international reliable brokers.
When using Copy Trading, market participants choose an experienced trader who provides his personal account so that beginners can automatically copy his deals. This allows newbies to close efficient trades like a pro according to the size of their deposit. In addition, they can manage copied trades and close them manually if needed.
One of the best companies to provide Copy trading services is HF Markets, which allows you to open an HFcopy account for both trading strategy providers and subscribers who join HFcopy. Providers can open an HFcopy account to build their subscriber list and trade in exchange for performance rewards. At the same time, subscribers, having opened an account, will be able to deposit funds and start copying the trades of their chosen professionals.
Best VPN for secure Forex trading

For secure and private asset trading and market analysis using Japanese candlesticks, it is best to use Top VPN services for Forex trading. VPNs allow you to redirect your traffic through not even one, but several locations, so you will always be protected from government or third-party spies. In addition, strong military-grade encryption algorithms will prevent your sensitive information such as passwords or credit details from leaking onto the Internet.
Surfshark VPN is a great service for Forex trading that can run on any popular operating system. In addition to convenient platforms, Surfshark VPN stands out for its lack of limits on the number of connections and traffic volume. It is a reliable VPN service provider with top-notch hardware and state-of-the-art encryption methods.
Click the button below to get the best VPN deal for Forex trading:
In addition to strong security, Surfshark VPN can unblock geo-restricted content on over 20 streaming platforms, including Hulu, Disney+, and even Amazon Prime with its notoriously difficult geo-blocking. Using their Smart DNS service, you can even watch streaming content on incompatible devices such as an unsupported smart TV.
Top trusted brokers for Forex trading
Japanese candlesticks are popular because of their simple yet highly informative visual nature. Candlesticks show the open, high, low, and close prices for a period. Their patterns are used by some traders to identify trading opportunities and potential trend reversals.
It is important to understand that the behavior of individual traders adds up to the overall movement of the market, which can be read using Japanese candlestick charts and their basic patterns. Consequently, your optimal trading decisions will be backed up by the most effective moments of entering or exiting a position, which will significantly improve your financial result.
To try this analysis method, international licensed Forex brokers provide free demo accounts with a deposit of up to $100 000 in order to make test trades based on Japanese candlesticks without risking your deposit. Also in the Forex market, traders can open several accounts in order not only to test their strategies on different trading platforms but also to try various tools and collect all kinds of Forex bonuses up to 100% on the first deposit.
Sign up, verify accounts and start trading with the Top Forex brokers below to compare trading platforms, select multiple instruments and try different market analysis methods.
XM Group Forex trading
XM Group is a global brokerage company licensed by the Australian Financial Commission (ASIC), Belize (IFCS), Dubai (DFSA), and Cyprus (CySEC).
Broker XM Group is a perfect choice to trade your favorite stocks, bonds, and derivatives. Except the broker has over 1000 trading instruments including Cryptocurrencies such as Bitcoin, Ethereum, and Ripple, currency pairs, commodities, metals, and energy.
The company’s clients can work on MT4/MT5 platforms that offer various accounts such as Micro, Standard, XM Ultra Low, and Shares with negative balance protection, leverage that meets the needs of different market participants, and the tightest spreads.
For novice traders, the platform provides a demo account. Using it, you can get comfortable in a new area for yourself without the risk of losing capital. The funds involved are virtual, but all operations are carried out in real-time, displaying real market trends.
Except for the common web version XM Group has a user-friendly mobile app to stay in touch 24/7 and a VPS service that allows traders not to worry about the speed of the Internet connection, power outage problems, or other disturbing factors. If you click the bottom right now you can get a special offer from TopForex.trade.
Exness Forex trading
Exness has been in the trading market since 2008 and during this time the team has achieved impressive speed in processing user requests. On the site, clients receive a variety of trading instruments such as currency pairs, stocks, indices, metals, energies, popular Cryptocurrencies such as Bitcoin and Ether, and others.
Exness clients are provided with a wide range of trading platforms, which includes MetaTrader 1, MetaTrader 4, MetaTrader 5, MetaTrader WebTerminal, or Exness Terminal’s own development. The broker also has a mobile app for iOS and Android, as well as a VPS server to increase connection speed and save money in the event of a sudden power outage or other factors.
The broker’s trading accounts are divided into standard retail, and professional ones, as well as a demo, to bring your trading skills to a professional level with a virtual balance without losing real money.
Exness provides its services to clients worldwide and is licensed by such regulatory bodies as FCA, CySEC, FSCA, FSC, FSA, and others. Try trading with Exness using our dedicated button below.
OANDA Forex trading
OANDA is a well-known broker for traders, which is distinguished by good quality of services and transparency of work. The company provides its clients with access to multiple financial markets, gaining the ability to trade Forex pairs and CFDs for indices, commodities, metals, Cryptocurrencies like Bitcoin and Ether, and bonds.
Traders can open three account types: demo, Standard, and Advanced Trader, which makes the broker a fine fit for both new and seasoned trades.
In addition, OANDA allows market participants to choose between OANDA Trade’s fully customizable co-web and desktop platforms and speculation in the Forex markets using MT4. In addition, the broker provides apps for mobile phones and tablets. On mobile, you can access over 50 technical tools including 32 indicator overlays, 11 drawing tools, and 9 chart types with the OANDA apps for iOS and Android.
OANDA has an extensive license base from regulators such as RFED (the US), MAS (Singapore), IIROC (Canada), FCA (Europe), FSA (Japan), and ASIC (Australia). Try all the OANDA opportunities by clicking our special button.
AvaTrade Forex trading
AvaTrade is a large international brokerage company that occupies a leading position in the market niche for providing services in online trading with such financial instruments as currency pairs; CFDs on almost all underlying assets, including commodities, stocks, and indices, more than 100 shares, Cryptocurrencies – Bitcoin, Litecoin; metals, energy commodities as well as agricultural production.
The broker allows you to trade on the MT4 and MT5 platforms. If you want to trade directly on the AvaTrade website, the provider offers its own platform. And, of course, mobile traders are not left out, as AvaTrade offers a full-fledged mobile application. That is available on both iOS and Android. In addition, AvaTrade has ZuluTrade and DupliTrade for the best Copy trading experience.
The company adheres to the highest safety standards in its work. AvaTrade is a registered and regulated broker that complies with the most stringent requirements of regulatory bodies such as MiFID, ASIC, Japan FSA and FFA, FSB, IIROC, and FSCA. Check all the AvaTrade opportunities by tapping on our special button.
Japanese candlesticks in Forex trading - FAQ