From charts to trades: analyzing the NASDAQ with key indicators and Top FX brokers
Analyzing stock market charts is a key skill for anyone wanting to understand market trends and make smart trading decisions. Whether you’re new to trading or have experience, learning to read these charts can help you navigate the financial markets better. In this article, we’ll look at the NASDAQ Composite using real data from Investing.com and explain important indicators and patterns traders use.
We’ll cover things like moving averages, volume analysis, RSI, and support and resistance levels. Each of these components will be broken down to help you understand how they fit into a trading strategy. This guide aims to give you practical tips on using these tools in your trading. Keep in mind that this is not financial advice—always do your own research and consider talking to a financial advisor before making any trading decisions.
A thorough guide to analyzing the NASDAQ chart
Now that we’ve set the stage, it’s time to dive into the analysis of the NASDAQ Composite chart. We’ll review each key indicator—moving averages, volume, RSI, and candlestick patterns—to comprehensively understand the current market conditions. By the end of this section, you’ll see how these elements come together to form a potential trading plan.
Disclaimer: The following is an educational guide for beginners on how to analyze stock market charts. This is not financial advice. Always do your research and consider consulting with a financial advisor before making any trading decisions.
Understanding the basic NASDAQ chart elements
1. Candlesticks
- Each candlestick on the chart represents a single day of trading. The body of the candlestick shows the opening and closing prices, while the wicks (shadows) represent the high and low prices for the day.
- Green candlestick: Indicates that the closing price was higher than the opening price (a bullish day).
- Red candlestick: Indicates that the closing price was lower than the opening price (a bearish day).
Check out: Understanding Japanese candlestick charts: basic figures and main patterns
2. Moving Averages (MA)
- 9-Day Moving Average (MA): This is a simple moving average calculated by averaging the closing prices of the last 9 days. It is used to smooth out price data and identify the direction of the trend.
- Position relative to price: When the price is above the moving average, it signals a bullish trend. When the price is below the moving average, it signals a bearish trend.
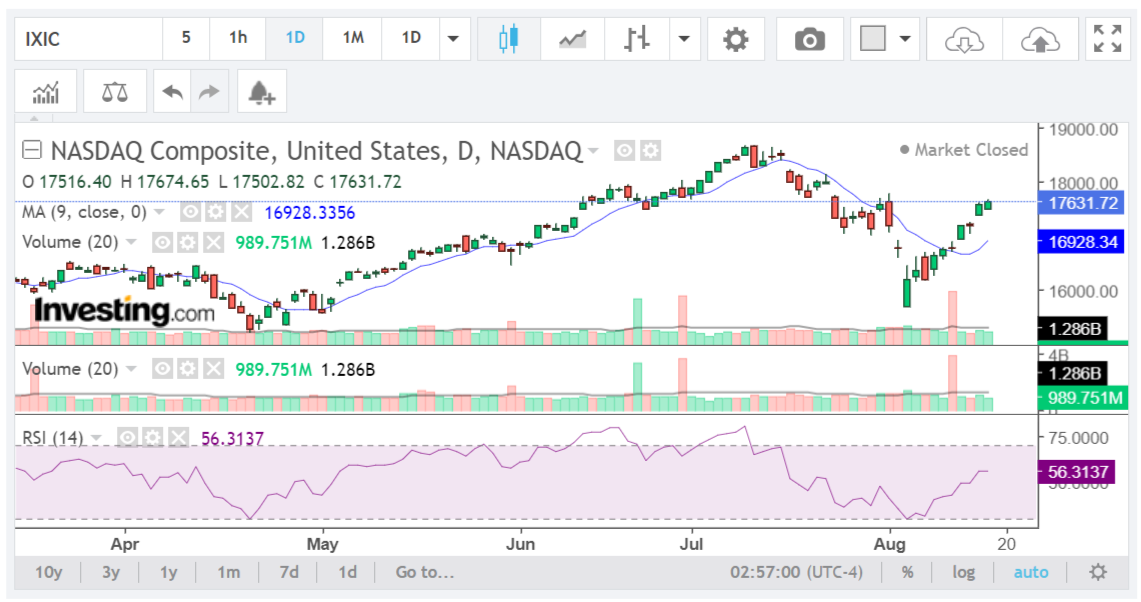
- In this chart: The current price of the NASDAQ Composite is above the 9-day MA (16,928.34), indicating a bullish short-term trend.
3. Volume analysis
- Volume bars: Volume represents the number of shares traded during a specific period.
- Green volume bar: Indicates that more shares were bought than sold (bullish).
- Red volume bar: Indicates that more shares were sold than bought (bearish).
- Volume spike: A significant increase in volume can confirm the strength of a price move.
- In this chart: Recent green volume bars suggest that the market is experiencing strong buying pressure, supporting the upward movement in price.
4. Relative Strength Index (RSI)
- RSI (14): This is a momentum oscillator that measures the speed and change of price movements. It ranges from 0 to 100 and helps identify overbought or oversold conditions.
Levels to watch:
- Above 70: Overbought conditions, which might indicate that the asset is overpriced and could see a price correction.
- Below 30: Oversold conditions, which might indicate that the asset is underpriced and could see a price rebound.
- Between 30 and 70: A neutral zone.
- In this chart: The RSI is currently at 56.31, suggesting that the market is in a neutral state with a slight bullish bias. It’s not in overbought territory, indicating that there might be room for the price to move higher.
5. Candlestick patterns
Recent candlestick behavior:
- Bullish candles: A series of green candles indicate a strong buying momentum.
- Doji or small body candles: These might indicate indecision in the market. If these appear after a strong trend, they could signal a potential reversal.
- In this chart: The recent pattern shows green candles, suggesting a recovery from the previous downtrend. This might indicate a continuation of the upward movement if it breaks above resistance levels.
6. Support and resistance levels
- Support: A price level where a downward trend might pause due to a concentration of buying interest.
- In this chart: The 9-day MA around 16,928.34 is acting as a key support level.
- Resistance: A price level where an upward trend might pause due to a concentration of selling interest.
- In this chart: The area around 17,700 – 17,800 is acting as a resistance level. If the price breaks above this level, it could signal further gains.
Putting it all together: NASDAQ trading plan
- Current trend: The NASDAQ Composite shows a bullish trend with strong volume support and a neutral RSI that leans towards bullishness.
Potential trade setup:
- Entry point: Consider entering a long (buy) position if the price breaks and closes above the resistance level of 17,700 – 17,800 with strong volume.
- Stop loss: Place a stop loss below the 9-day MA (around 16,900) to limit potential losses if the market reverses.
- Take profit: Set a target at 18,000 or trail your stop loss as the price moves higher to capture gains while reducing risk.
NOTE: Check out Forex risk management tools: automatic trading with popular market orders
Final thoughts:
- Risk management: Always use a stop loss to protect against unexpected market movements.
- Adapt to market conditions: While this analysis provides a framework, markets can be unpredictable. Be ready to adapt your strategy as new data emerges.
- Continuous learning: Keep studying different indicators, patterns, and market dynamics to improve your trading skills over time.
By following this structured approach to analyzing the NASDAQ Composite, you can develop a more disciplined trading strategy. Remember, effective trading is as much about managing risk as it is about identifying opportunities.
Top Forex brokers to trade NASDAQ stock
With a solid understanding of how to analyze the NASDAQ Composite chart, the next step is choosing the right platform to execute your trades. Selecting a reliable and user-friendly broker is crucial for effective trading indices like the NASDAQ. In this section, we’ll introduce you to some of the top FX brokers that offer NASDAQ trading. These brokers are known for their competitive spreads, robust trading platforms, and excellent customer service, making them ideal choices for both beginner and experienced traders looking to capitalize on market opportunities.
XTB FX trading
If you’re interested in trading on the NASDAQ Composite, XTB is a great platform to consider. XTB is a leading Forex and CFD broker that operates in over 190 countries, known for its security, transparency, and regulation by major authorities like the FCA, CySEC, and KNF.
With XTB, you can access a broad range of trading options, including CFDs on forex pairs, indices, commodities, shares, and cryptocurrencies. The NASDAQ Composite, which includes thousands of tech-driven companies, can be traded using XTB’s intuitive platforms like xStation and MetaTrader 4. These platforms offer advanced tools to help you analyze the market and execute trades effectively.
XTB also supports various trading styles by offering different account types, such as Standard and swap-free accounts, each with distinct features and fee structures. In addition, XTB provides valuable research and analysis tools, including daily market updates, economic calendars, and webinars, which can help you make informed decisions when trading on the NASDAQ Composite.

Exness FX trading
Exness is a respected Forex broker that offers a variety of trading options, including currency pairs, commodities, indices, and cryptocurrencies.
With regulation by top authorities like the FCA in the UK and CySEC in Cyprus, Exness ensures a secure trading environment for its users.
The broker provides competitive spreads across different account types, such as Standard and Professional, each tailored with unique features to suit various trading needs.
Exness supports widely-used platforms like MetaTrader 4 (MT4) and MetaTrader 5 (MT5), which are known for their user-friendly interface and advanced charting tools. For assistance, Exness offers customer support through email, live chat, and phone.
HF Markets FX trading
HF Markets is a great choice for traders looking for a wide variety of asset trading options. With access to over 1,200 financial instruments, including currency pairs, energies, indices, commodities, ETFs, stocks, and bonds, HF Markets caters to a broad range of trading preferences.
The broker supports several trading platforms, including MT4 and MT5, available on desktop, web, and mobile devices. They also offer a dedicated trading app for added convenience and a VPS service to boost trading performance.
HF Markets provides a variety of account types, including Premium, Pro, Zero, and Cent accounts, each with different minimum deposits, leverage options, and spreads. For those interested in gold trading, HF Markets offers special conditions tailored to this market.
For beginners, HF Markets offers a demo account, allowing you to practice your strategies and get familiar with different instruments before committing real capital.

OANDA FX trading
OANDA is a long-standing online broker, established in 1996, known for its reliability and strong customer service. The broker provides a secure trading environment, making it a trusted choice for many traders.
OANDA offers competitive spreads and flexible leverage options, allowing traders to tailor their positions to fit their strategies and risk tolerance. You can trade on popular platforms like MetaTrader 4 or OANDA’s own platform, OANDA Trade, which features advanced charting tools and expert advisors for technical analysis and algorithmic trading.
OANDA is also recognized for its extensive range of tools and resources designed to enhance the trading experience. This includes daily and weekly market analysis, up-to-date forex news, and insightful commentary to keep traders informed and supported.
AvaTrade FX trading
AvaTrade, founded in 2006, is a well-known broker with a strong global presence and a reputation for reliability. It’s regulated by top authorities like the Central Bank of Ireland and ASIC, ensuring a safe trading environment.
If you’re looking to trade on the NASDAQ Composite, AvaTrade offers some great benefits. You can choose from different account types—like Standard, Gold, Platinum, and VIP—depending on your trading style. AvaTrade provides competitive spreads on NASDAQ stocks, helping you keep trading costs low, and offers flexible leverage options to help you manage larger positions with less capital. However, it’s important to use leverage carefully.
AvaTrade supports advanced trading platforms like MT4 and MT5, which offer powerful charting tools and quick execution. To help manage risk, the broker offers features like stop-loss and take-profit orders. Additionally, AvaTrade provides educational resources, such as webinars and market analysis, to keep you informed about market movements on the NASDAQ Composite.
Related articles:
Analyzing the NASDAQ Composite - FAQ