How to analyze Apple Inc. (AAPL) stock: key indicators and chart analysis guide
Apple Inc. (AAPL) is a favorite among investors in the fast-changing world of stock trading due to its strong performance and market presence. This article briefly examines Apple’s stock using key indicators like the Simple Moving Average (SMA), trading volume, and the Relative Strength Index (RSI). We’ll provide an example of how to analyze stock charts, including entry and exit points, stop-loss suggestions, and market predictions. This is not a recommendation, but a guide to help you understand Apple’s stock better.
Apple Inc. (AAPL) stock analysis: key indicators, entry & exit points
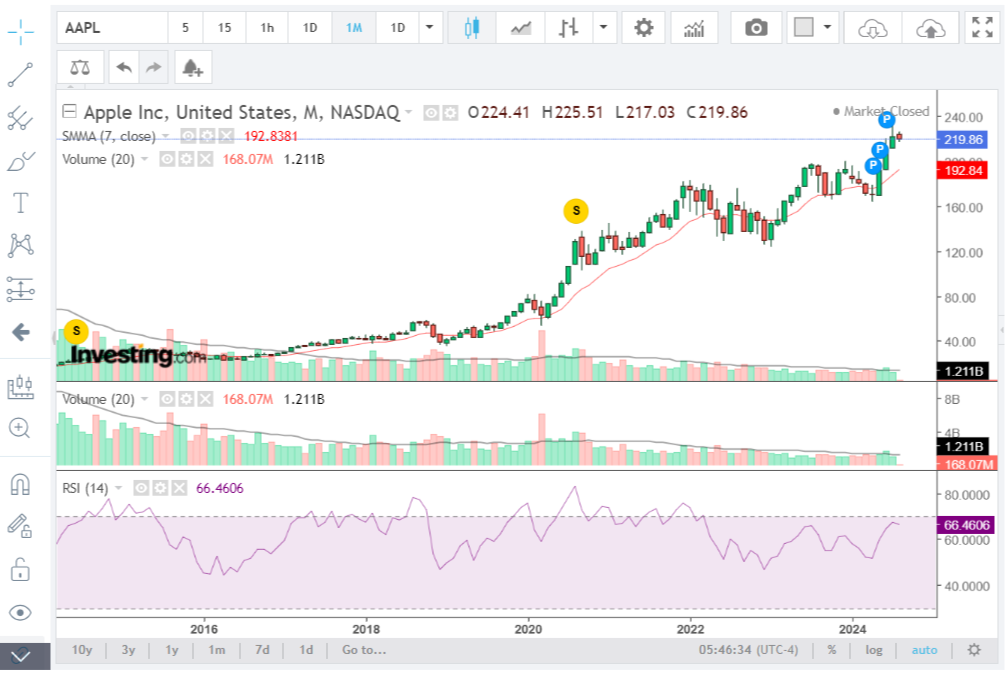
Let’s dive into a detailed chart analysis of Apple Inc. (AAPL) using a real August 2024 chart from Investing.com. We’ll develop a thorough trading plan based on key indicators and technical analysis tools to help you make informed decisions.
Apple Inc. (AAPL) stock chart analysis
Simple Moving Average (SMA) – 7 periods (Red Line)
- The 7-period SMA is currently at 192.8381.
- The stock price is trading above this SMA, indicating a bullish trend. Moving averages are a useful indicator of the general direction of the stock’s price. When the price is above the SMA, it often suggests that the stock is in an uptrend.
Volume
- The volume for the current period is 168.07M shares.
- The 20-period moving average volume stands at 1.211B shares.
Volume analysis is crucial as it reflects the number of shares traded. Decreasing volume, as seen in the chart, could indicate a weakening of the current buying momentum or a consolidation phase. This might be a precursor to a potential reversal or a period of sideways movement.
Relative Strength Index (RSI) – 14 periods
- The RSI is at 66.4606.
- RSI is a momentum oscillator that measures the speed and change of price movements. Values above 70 typically suggest overbought conditions, while values below 30 indicate oversold conditions. An RSI of 66.46 suggests the stock is approaching overbought territory but hasn’t quite reached it yet, indicating potential room for upward movement but also caution for a potential pullback.
Price movements and key levels
- Current price: 219.86
- High of the period: 225.51
- Low of the period: 217.03
- The stock is near its recent highs, indicating strong upward momentum. The recent highs and lows help identify support and resistance levels which are crucial for setting entry and exit points.
Candlestick patterns and trends
- The chart shows a strong bullish trend with higher highs and higher lows over time.
- There are two recent “P” indicators on the chart, likely marking dividend payments or other significant corporate actions, which can sometimes influence stock price due to changes in investor sentiment.
NOTE: Learn more about bulls and bears in the Forex market.
Visual indicators
To make the analysis clearer, let’s highlight the following on the chart:
- SMA (7): A red line around the 192.8381 level.
- Volume: Recent volume bars with the latest at 168.07M, showing a decreasing trend.
- RSI (14): Displayed below the main chart with a current value of 66.4606, indicating it’s close to overbought territory.
Apple stock predictions and trading plan
Future stock behavior
- Continuation of bullish momentum: Given the stock is above the SMA(7) and close to its recent highs, the bullish momentum is likely to continue in the short term. This suggests a positive sentiment among investors.
- Potential pullback or consolidation: With the RSI nearing 70, the stock might experience a pullback or consolidation phase soon. This would be a healthy correction in a long-term uptrend.
- Volume consideration: The decreasing volume could indicate that the current upward move may be losing steam. It’s essential to watch for any significant changes in volume as they can provide early signals of trend reversals.
Trading plan:
Entry point:
- Aggressive entry: For those willing to take on more risk, entering at current levels around 219.86 could be a good option, banking on the continued bullish trend.
- Conservative entry: A more cautious approach would be to wait for a pullback to the SMA(7) level around 192.84 or another significant support level. This provides a better risk-reward ratio and minimizes potential downside.
Exit point:
- Short-term target: Set an initial target around the recent high of 225.51. This would be a logical place to take some profits off the table.
- Long-term target: If the bullish trend continues, the next resistance levels could be in the 240-250 range, providing a longer-term target for more significant gains.
Stop loss:
- Protective stop: Place a stop loss slightly below the SMA(7) or recent support levels, around 190-195. This helps protect against significant downside risks and limits potential losses.
NOTE: Check out Forex risk management tools: automatic trading with popular market orders
Monitoring:
- Regular monitoring of RSI: Keep an eye on the RSI for signs of overbought conditions. If RSI crosses above 70, it might be time to consider reducing exposure or tightening stop losses.
- Volume trends: Monitor volume closely. An increase in volume on up days would confirm the bullish trend while increasing volume on down days might signal a trend reversal.
Technical analysis provides valuable insights, but it’s also important to consider broader market conditions and news that might impact Apple Inc. (AAPL). Always perform your own due diligence and consider your risk tolerance before making any trading decisions. Combining technical indicators with fundamental analysis and market news can offer a more comprehensive view and aid in making informed trading choices.
Pro tip: If you’re new to trading Apple Inc. (AAPL) stock, start by using demo accounts. Demo accounts allow you to practice trading with virtual funds in a risk-free environment, helping you get familiar with the platform and refine your strategies before committing real money.
Top Forex brokers to trade Apple stock
If you’re interested in trading Apple Inc. (AAPL) stock through the Forex market, choosing the right broker is crucial. Forex brokers offer various platforms and tools to help you manage your trades effectively. To assist you in finding the best fit for your trading needs, we’ve compiled a list of top Forex brokers that provide excellent access to Apple stock. Explore these options to ensure you have the right resources and support for a successful trading experience.
XTB FX trading
When you’re ready to trade Apple stocks, XTB is an excellent choice. As a leading broker in Forex and CFD trading, XTB operates in over 190 countries and is renowned for its financial security and transparency. It is regulated by esteemed authorities like the FCA, CySEC, and KNF.
XTB provides a broad range of trading options with over 1,500 CFDs, including forex pairs, indices, commodities, shares, and cryptocurrencies. You can trade Apple stock using XTB’s user-friendly platforms, such as xStation and MetaTrader 4, which offer advanced tools for making informed trading decisions.
XTB also supports various trading styles with account types like Standard and swap-free accounts, each offering unique features and fee structures. Additionally, XTB equips traders with a wealth of research and analysis resources, including daily market reports, economic calendars, and webinars, to stay ahead of market trends and key events.

Exness FX trading
Exness is a well-regarded Forex broker known for its wide range of trading options, including currency pairs, commodities, indices, and cryptocurrencies.
Regulated by top authorities such as the FCA in the UK and CySEC in Cyprus, Exness ensures a secure trading environment.
The broker offers competitive spreads that vary by account type. Traders can choose from Standard and Professional accounts, each with distinct benefits and conditions.
Exness provides customer support through email, live chat, and phone. It also supports popular trading platforms like MetaTrader 4 (MT4) and MetaTrader 5 (MT5), both of which are celebrated for their user-friendliness and advanced charting tools, making for a smooth trading experience.
BlackBull FX trading
BlackBull Markets is a trusted Forex broker offering a diverse array of trading instruments. Traders can access commodities, currency pairs, stocks, futures, indices, and cryptocurrencies, providing a wide range of market opportunities.
Regulated in Seychelles, BlackBull emphasizes trader safety and regulatory compliance. It offers several account types, including standard, prime, institutional, and Islamic (swap-free) accounts, as well as a demo account for risk-free practice.
BlackBull is known for its versatile trading platforms, including MT4, MT5, cTrader, Web Trader, and TradingView. It also features specialized tools like BlackBull CopyTrader and BlackBull Shares, with mobile and tablet apps for convenient access.
Additionally, BlackBull is committed to trader education, providing an educational hub, webinars, and tutorials to help traders improve their skills and knowledge.
XM Group FX trading
XM Group, founded in 2009 and based in Belize, is a trusted online broker for Forex and CFD trading. It is regulated by major financial authorities like the Cyprus Securities and Exchange Commission (CySEC) and the UK’s Financial Conduct Authority (FCA), ensuring a secure trading environment.
XM Group stands out for its security features, including 2-step authentication to protect your account.
The broker offers a wide range of trading options, such as currency pairs, stocks, commodities, and indices, so you can explore various markets and diversify your investments. The platform is user-friendly and provides helpful tools for both beginners and experienced traders.
XM Group also features competitive spreads and different account types to fit your trading needs. Whether you’re new and using a demo account or an advanced trader seeking special features, XM Group has the resources you need for successful trading.

OANDA FX trading
OANDA is a reliable online broker with a long history dating back to 1996. Known for its trustworthiness and focus on customer service, OANDA ensures a secure trading environment for its users.
The broker offers competitive spreads and flexible leverage options, allowing traders to tailor their positions to fit their strategies and risk levels. You can use popular trading platforms like MetaTrader 4 or OANDA’s own platform, OANDA Trade, which features advanced charting tools and expert advisors to make technical analysis and algorithmic trading easier.
OANDA is also praised for its range of tools and features that enhance the trading experience, including daily and weekly market analysis, forex news, and commentary.
Related articles:
Apple stock analysis and trading plan - FAQ