Top FX brokers for trading the S&P 500 index: a complete guide to analysis and predictions
When it comes to investing in the stock market, the S&P 500 is a benchmark that captures the performance of 500 of the largest publicly traded companies in the U.S. This index serves as a vital indicator for investors looking to gauge the overall health of the market and identify lucrative opportunities within it. However, navigating the complexities of S&P 500 stocks requires more than just a surface-level understanding. In this guide, we will delve into the essential tools and techniques for analyzing S&P 500 stocks, focusing on key financial indicators, chart analysis, and the role of top Forex (FX) brokers in executing informed trades.
A detailed explanation of the S&P 500 chart analysis
This guide provides a step-by-step analysis of a real S&P 500 chart sourced from Investing.com. It is designed to help beginners understand how to interpret key technical indicators such as Bollinger Bands (BB), Moving Average Convergence Divergence (MACD), and volume. These indicators are commonly used by traders to assess market trends and make informed decisions. Please note that this analysis is purely educational and should not be considered financial advice or a trading recommendation. The purpose is to illustrate how one might approach chart analysis to better understand market movements.
Disclaimer: The following analysis is for educational purposes only. It is not financial advice or a recommendation to trade. It is intended as a guide for beginners on how to approach chart analysis.
S&P 500 chart overview
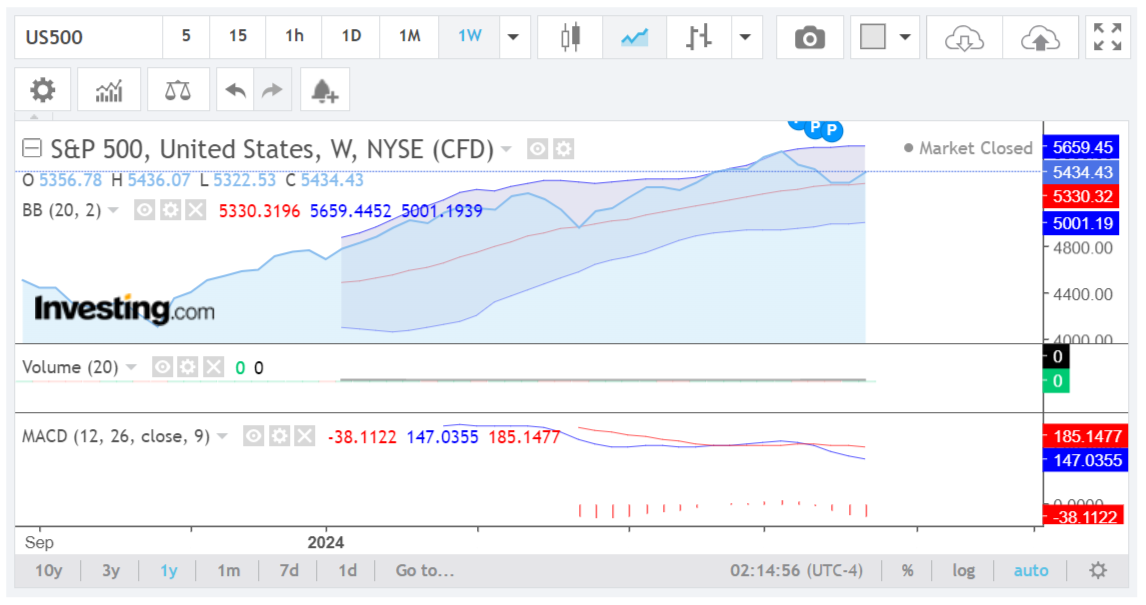
The chart is a weekly time frame of the S&P 500 index, representing the overall performance of the U.S. stock market. Weekly charts are useful for analyzing long-term trends and identifying significant support and resistance levels.
Pro tip: Learn more about Technical analysis for Forex traders: charts and trading patterns.
1. Understanding Bollinger Bands (BB)
Bollinger Bands are a volatility indicator that consists of three lines:
- Upper band (5659.45): This is two standard deviations above the middle band (moving average). When the price is near the upper band, the market may be overbought, suggesting it might be due for a pullback.
- Middle band (5330.32): This is a 20-period simple moving average (SMA). It represents the average price over the last 20 periods. This line often acts as a mean reversion level, where prices tend to gravitate towards.
- Lower band (5001.19): This is two standard deviations below the middle band. When the price approaches the lower band, it could indicate an oversold market, suggesting a possible buying opportunity.
Current status:
- The S&P 500 is trading around 5434.43, which is closer to the middle band, indicating that the market is in a neutral zone. It is neither significantly overbought nor oversold at this point.
Interpretation:
- If the price moves towards the upper band: This could signal a potential overbought condition. Traders might consider selling or taking profits if the price nears this level.
- If the price drops towards the lower band: This could indicate an oversold condition, possibly leading to a bounce or buying opportunity.
2. Understanding MACD (Moving Average Convergence Divergence)
The MACD is a momentum indicator that shows the relationship between two moving averages of an asset’s price:
- MACD line (-38.11): This is calculated by subtracting the 26-period EMA from the 12-period EMA. A negative value indicates bearish momentum (price is declining faster in the short term compared to the long term).
- Signal line (147.04): This is the 9-period EMA of the MACD line. It acts as a trigger line; when the MACD crosses below it, a bearish signal is generated.
- Histogram (red bars): These bars represent the difference between the MACD line and the Signal line. If the bars are below the zero line and getting shorter, it means bearish momentum is decreasing; if they are getting longer, bearish momentum is increasing.
Current status:
The MACD line is negative and below the signal line, indicating bearish momentum. The histogram bars are red, reflecting that the bearish momentum is still strong.
Interpretation:
- Bearish crossover: When the MACD line crosses below the Signal line, it suggests that the market is likely to move downwards. This is a bearish signal.
- Bullish crossover: Conversely, if the MACD line crosses above the Signal line, it would suggest upward momentum and could be a signal to buy.
3. Volume indicator
Volume measures the number of shares or contracts traded in a given period. It is crucial in confirming trends:
- High volume: Strong moves with high volume are more likely to continue in the direction of the move.
- Low volume: Moves with low volume might indicate a lack of conviction and could be prone to reversals.
Current status:
The volume indicator shows “0” on this chart, indicating no volume data is available. This could be due to the chart representing a CFD (Contract for Difference), which doesn’t always track actual traded volume. In real-time trading, always check the volume data on other charts or sources to confirm trends.
S&P 500 predictions and trading plan
Short-term price prediction:
- Neutral to bearish bias: Given the position near the middle Bollinger Band and the bearish MACD, the short-term outlook suggests the potential for further downside or sideways movement. The price might drift towards the lower Bollinger Band around 5001.19 if the bearish momentum persists.
Long-term price prediction:
- Cautiously bearish: If the bearish momentum continues and the S&P 500 breaks below the middle band, it could signal a more extended correction, possibly pushing prices towards the lower band. However, if the price finds support near the middle band and the MACD starts to show signs of bullish divergence, the outlook could shift to neutral or bullish.
Trading plan:
For bearish traders:
- Entry: Consider shorting if the price moves closer to the middle Bollinger Band and if the MACD continues to show bearish momentum.
- Stop-loss: Place a stop-loss slightly above the upper Bollinger Band or a recent high to limit potential losses.
NOTE: Check out Forex risk management tools: automatic trading with popular market orders
- Take-profit: Consider taking profit as the price approaches the lower Bollinger Band, especially if volume confirms the move.
For bullish traders:
- Entry: Consider buying if the price finds support around the middle or lower Bollinger Band and if the MACD starts to show signs of a bullish crossover.
- Stop-loss: Set a stop-loss slightly below the lower Bollinger Band to protect against further downside.
- Take-profit: Look to take profit near the upper Bollinger Band or a recent high.
The S&P 500 currently shows signs of bearish momentum, with the price hovering near a neutral zone (middle Bollinger Band). Traders should watch for further developments in the MACD and price action relative to the Bollinger Bands to make informed decisions.
As always, combining this technical analysis with other tools, such as fundamental analysis and market sentiment, will provide a more comprehensive view of the market. Additionally, risk management (e.g., using stop-losses and position sizing) is essential in any trading strategy.
Top Forex brokers to trade S&P 500
If you’re looking to trade the S&P 500, choosing the right Forex broker is essential. The S&P 500 is a popular index that offers traders exposure to the performance of the largest U.S. companies. To help you get started, we’ve compiled a list of top Forex brokers known for their reliability, competitive spreads, and advanced trading platforms. These brokers offer CFDs on the S&P 500, allowing you to speculate on the index’s price movements without needing to purchase individual stocks.
Pro tip: Before choosing a Forex broker, check Forex brokers with the best reputation among real traders.
XTB S&P 500 trading
If you’re looking to trade the S&P 500, XTB is a solid choice. As a Top Forex and CFD broker, XTB operates in over 190 countries and is known for its strong security and transparency. It’s regulated by key authorities like the FCA, CySEC, and KNF.
XTB offers a wide range of trading options, including CFDs on forex pairs, indices, commodities, shares, and cryptocurrencies. For example, you can trade S&P 500 using XTB’s user-friendly platforms, such as xStation and MetaTrader 4, which come equipped with advanced tools to enhance your trading experience.
XTB caters to various trading styles with account types like Standard and swap-free accounts, each offering different features and fee structures. Additionally, XTB provides valuable research and analysis resources, including daily market updates, economic calendars, and webinars, to help you stay informed and make informed trading decisions.

Exness S&P 500 trading
Exness is a popular Forex broker known for offering a variety of trading options, including currency pairs, commodities, indices, and cryptocurrencies.
It’s regulated by top authorities like the FCA in the UK and CySEC in Cyprus, ensuring a safe trading environment.
Exness offers competitive spreads that differ based on the account type. Traders can choose between Standard and Professional accounts, each with its own advantages.
The broker provides customer support through email, live chat, and phone. Exness also supports widely-used trading platforms like MetaTrader 4 (MT4) and MetaTrader 5 (MT5), which are known for their ease of use and advanced charting tools, making trading straightforward.
BlackBull S&P 500 trading
BlackBull Markets is a reliable Forex broker that offers a wide range of trading options, including commodities, currencies, stocks, futures, indices, and cryptocurrencies, giving traders plenty of opportunities.
Regulated in Seychelles, BlackBull ensures a safe and compliant trading environment. They offer different account types, including standard, prime, institutional, and Islamic (swap-free) accounts, along with a demo account for practicing without risk.
BlackBull supports various trading platforms like MT4, MT5, cTrader, Web Trader, and TradingView, as well as mobile and tablet apps for easy access. They also provide tools like BlackBull CopyTrader and BlackBull Shares for more specialized trading.
To help traders improve, BlackBull offers an educational hub with webinars and tutorials.
eToro S&P 500 trading
eToro, founded in 2007, has made trading the S&P 500 accessible and engaging for traders worldwide. It offers a user-friendly platform with features like social trading, allowing you to follow and copy the trades of experienced investors. With a strong regulatory oversight, eToro is a trusted option for trading.
When trading the S&P 500 on eToro, you can connect with other traders, replicate their strategies, and trade without extra fees. The platform is easy to use and comes with advanced charting tools to help you make informed decisions. eToro also offers CopyPortfolios, letting you invest in professionally managed portfolios that include S&P 500 stocks.
To start trading the S&P 500 on eToro, sign up, verify your identity, and deposit funds using various methods. Then, search for the S&P 500 index or individual stocks within it, set your trade parameters, and execute your trades.
Risk disclaimer: eToro is a multi-asset platform which offers both investing in stocks and cryptoassets, as well as trading CFDs.
CFDs are complex instruments and come with a high risk of losing money rapidly due to leverage. 51% of retail investor accounts lose money when trading CFDs with this provider. You should consider whether you understand how CFDs work, and whether you can afford to take the high risk of losing your money.
This communication is intended for information and educational purposes only and should not be considered investment advice or investment recommendation. Past performance is not an indication of future results.
Copy Trading does not amount to investment advice. The value of your investments may go up or down. Your capital is at risk.
Don’t invest unless you’re prepared to lose all the money you invest. This is a high-risk investment and you should not expect to be protected if something goes wrong. Take 2 mins to learn more.
eToro USA LLC does not offer CFDs and makes no representation and assumes no liability as to the accuracy or completeness of the content of this publication, which has been prepared by our partner utilizing publicly available non-entity specific information about eToro.
AvaTrade S&P 500 trading
AvaTrade, established in 2006, is a trusted Forex broker with a global reach, serving over 300,000 clients. It’s regulated by authorities like the Central Bank of Ireland and ASIC, making it a reliable choice for traders.
For trading the S&P 500, AvaTrade offers several benefits. You can choose from different account types to suit your trading style, and the broker provides competitive spreads, keeping your trading costs low. AvaTrade also offers flexible leverage options, which allow you to trade larger positions with less capital, though it’s important to use leverage carefully.
AvaTrade supports advanced trading on platforms like MT4 and MT5, which offer powerful charting tools and fast execution speeds. To help you manage your trades, AvaTrade provides risk management tools like stop-loss and take-profit orders. Additionally, they offer educational resources, including webinars and market analysis, to keep you informed about the S&P 500 and other markets.
OANDA S&P 500 trading
OANDA, established in 1996, is a trusted online broker known for its reliability and strong customer service. It provides a secure trading environment for its users.
OANDA offers competitive spreads and flexible leverage, allowing traders to customize their positions based on their strategies and risk preferences. You can trade on popular platforms like MetaTrader 4 or OANDA’s own platform, OANDA Trade, which comes with advanced charting tools and expert advisors to simplify technical analysis and algorithmic trading.
OANDA is also well-regarded for its wide range of tools, including daily and weekly market analysis, forex news, and expert commentary, all aimed at enhancing the trading experience.
Related articles:
S&P 500 index analysis - FAQ