The Dow Jones Industrial Average (DJI) analysis unveiled: Moving Averages, RSI, Bollinger Bands, and Top FX brokers
Understanding how to analyze major indices like the Dow Jones Industrial Average (DJI) is essential for both experienced investors and beginners. The DJI, a key U.S. stock market benchmark, reflects the health of the economy by tracking 30 large companies.
To navigate the market, traders use technical indicators like Moving Averages (MAs), the Relative Strength Index (RSI), Bollinger Bands, and trading volume. These tools help assess trends and predict price movements.
In this article, we’ll analyze the DJI using these indicators. We’ll also highlight top FX brokers that offer the best trading platforms and tools. Whether you’re diversifying your portfolio or sharpening your trading skills, understanding these basics will help you make better decisions.
A guide to analyzing the Dow Jones Industrial Average (DJI) chart
Disclaimer: This chart analysis is intended as a guide for beginners on how to interpret stock charts and indicators. It is not a recommendation to buy or sell any financial instruments. Always do your own research or consult with a financial advisor.
The real chart is taken from the Investing.com website.
Pro tip: Learn more about Technical analysis for Forex traders: charts and trading patterns.
Understanding the key Dow Jones chart elements
1. Trend analysis:
Price movement:
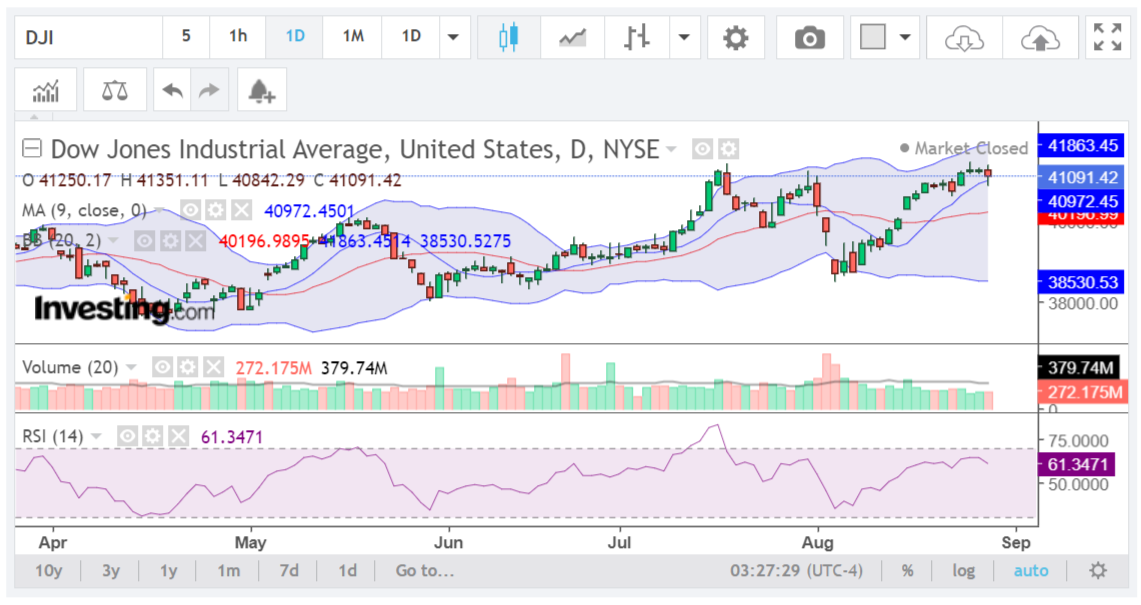
- Looking at the chart, the Dow Jones Industrial Average (DJI) has been generally moving upward since June, which tells us that the market has been in a bullish (upward) trend for a couple of months now.
- The candles (which represent daily price movements) mostly have longer bodies during upward moves, indicating strong buying pressure. But notice that after each strong rally, there’s a bit of pullback or sideways movement, which is normal as markets don’t move in a straight line.
Read more: Understanding Japanese candlestick charts: basic figures and main patterns
Moving Average (MA):
- The blue line you see on the chart is the 9-day moving average (MA). A moving average smooths out price data to identify the direction of the trend. Here, the price is hovering slightly above the moving average, which is a sign that the market is still in an upward trend, but it’s not accelerating rapidly.
- When prices are above the MA, it’s typically a bullish sign. However, the fact that the price is not far above the MA suggests we could be nearing a point of consolidation or even a minor pullback.
2. Momentum analysis:
Relative Strength Index (RSI):
- The RSI, which is the purple line at the bottom, is at 61.3471. RSI measures the speed and change of price movements on a scale from 0 to 100.
- An RSI around 50 suggests the market is in neutral territory; above 50 indicates bullish momentum, while below 50 indicates bearish momentum. Since the RSI is above 50 but below 70, it suggests that there is still buying interest, but the market isn’t overheated yet.
- If the RSI were to rise above 70, it could signal that the market is becoming overbought, and a correction might be due. Right now, though, the RSI tells us that there’s some room for the market to keep climbing.
3. Volatility analysis:
Bollinger Bands:
- Bollinger Bands, those blue bands that wrap around the price chart, are a volatility indicator. They expand when volatility increases and contract when volatility decreases.
- Currently, the price is near the upper band, which is at 41863.45. The middle band is around 40972.45, and the lower band is at 40196.99. The upper band represents a potential resistance level where the price might struggle to go higher.
- The widening of the bands suggests increasing volatility, meaning that price swings could become more significant. When the price hits the upper band, it’s often a sign that the market is overextended to the upside, which could lead to a pullback or consolidation. However, if the price can break through the upper band, it could signal strong bullish momentum and further gains.
4. Volume analysis:
Volume bars:
- Volume tells us how much of the asset is being traded. The green and red bars represent daily trading volumes, with green showing days where the price closed higher than it opened and red showing the opposite.
- Recently, there’s been higher trading volume on up days (green bars), with the most recent volume being 379.74M compared to the average of 272.175M. This higher volume on up days indicates that there’s significant buying interest, which supports the current upward trend.
- High volume on up days is a positive sign, showing that the rally has some substance behind it. However, if you see a sudden spike in volume on a down day, it could indicate a reversal.
Dow Jones price prediction and trading plan
Prediction:
- Given the current indicators, the DJI might continue its upward movement in the short term, potentially testing the resistance around the upper Bollinger Band at 41863.45. However, since the RSI is not yet overbought, and the price is near the upper Bollinger Band, we could see a brief pullback or consolidation before any further significant gains.
Trading plan:
For Bulls (optimists):
- If you’re holding long positions, you might consider taking some profits as the price approaches the upper Bollinger Band. Alternatively, you could keep your position but set a tighter stop-loss to protect against a sudden drop.
- Watch for a break above 41863.45 with strong volume as a signal to add to your position.
Check out: Bulls and bears in the Forex market: basic concepts explained
For Bears (pessimists):
- If you’re looking for a short opportunity, wait for signs of weakness, such as the price failing to break above the upper Bollinger Band or the RSI moving closer to overbought territory (above 70).
- A break below the moving average could be a signal to go short or at least stay out of long positions for the time being.
Neutral position:
- If you’re uncertain, it might be wise to wait for clearer signals. A move above 41863.45 on high volume could justify a bullish stance, while a failure to do so could mean a short-term correction is on the horizon.
The Dow Jones Industrial Average is currently in a bullish trend but may be approaching a key resistance level. Monitoring the RSI, Bollinger Bands, and volume can help in making informed decisions. Remember, the market can be unpredictable, and it’s essential to stay flexible and protect your investments with appropriate risk management strategies.
Top Forex brokers to trade Dow Jones
After analyzing the Dow Jones Industrial Average (DJI) with key indicators, the next step is finding the right platform to trade. Choosing a reliable FX broker is essential for executing trades efficiently, whether you’re trading the DJI directly or through CFDs.
In this section, we’ll introduce some of the top FX brokers known for their user-friendly platforms, competitive spreads, and strong customer support. These brokers are ideal for traders looking to effectively capitalize on the movements of the Dow Jones Industrial Average.
Pro tip: Before choosing a Forex broker, check Forex brokers with the best reputation among real traders.
XTB Dow Jones trading
Here are the main features of trading on the Dow Jones Industrial Average (DJI) with XTB:
- Global presence: XTB operates in over 190 countries.
- Regulation and Security: Regulated by major authorities like FCA, CySEC, and KNF, ensuring security and transparency.
- Wide range of instruments: Trade CFDs on forex pairs, indices, commodities, shares, and cryptocurrencies.
- Advanced trading platforms: Access to xStation and MetaTrader 4, which offer advanced market analysis and trade execution tools.
- Support for various trading styles: Different account types available, including Standard and swap-free accounts, each with unique features and fee structures.
- Research and analysis tools: Provides daily market updates, economic calendars, and webinars to aid in making informed trading decisions.

Exness Dow Jones trading
Here are the main features of trading with Exness:
- Regulation and security: Regulated by top authorities like FCA (UK) and CySEC (Cyprus), ensuring a secure trading environment.
- Diverse trading options: Offers trading in currency pairs, commodities, indices, and cryptocurrencies.
- Competitive spreads: Provides competitive spreads across various account types, including Standard and Professional, each designed to meet different trading needs.
- Trading platforms: Supports popular platforms like MetaTrader 4 (MT4) and MetaTrader 5 (MT5), known for their user-friendly interfaces and advanced charting tools.
- Customer support: Available through email, live chat, and phone for assistance.
BlackBull Dow Jones trading
Here are the main features of trading with BlackBull Markets:
- Wide range of trading options: Offers commodities, currencies, stocks, futures, indices, and cryptocurrencies.
- Regulation: Regulated in Seychelles, ensuring a safe and compliant trading environment.
- Varied account types: Provides Standard, Prime, Institutional, and Islamic (swap-free) accounts, plus a demo account for risk-free practice.
- Multiple trading platforms: Supports MT4, MT5, cTrader, Web Trader, and TradingView, with mobile and tablet apps for convenient access.
- Specialized tools: Includes BlackBull CopyTrader and BlackBull Shares for advanced trading strategies.
- Educational resources: Offers an educational hub with webinars and tutorials to help traders improve their skills.
OANDA Dow Jones trading
Here are the main features of trading with OANDA:
- Established broker: Founded in 1996, known for its reliability and strong customer service.
- Secure trading environment: Provides a trustworthy platform for traders.
- Competitive spreads and flexible leverage: Offers competitive spreads and customizable leverage to match various trading strategies and risk profiles.
- Popular trading platforms: Access to MetaTrader 4 and OANDA’s proprietary platform, OANDA Trade, which includes advanced charting tools and support for algorithmic trading.
- Comprehensive tools and resources: Provides daily and weekly market analysis, up-to-date forex news, and insightful commentary to support and inform traders.
AvaTrade Dow Jones trading
Here are the main features of trading the Dow Jones Industrial Average (DJI) with AvaTrade:
- Established broker: Founded in 2006, AvaTrade is known for its strong global presence and reliability.
- Regulation: Regulated by major authorities such as the Central Bank of Ireland and ASIC, ensuring a secure trading environment.
- Trading on Dow Jones: AvaTrade offers competitive spreads and flexible leverage options for trading the Dow Jones Industrial Average (DJI). Traders can select from various account types, including Standard, Gold, Platinum, and VIP, to suit different trading preferences.
- Advanced trading platforms: Access to MT4 and MT5, which provide robust charting tools and fast trade execution.
- Risk management tools: Includes features like stop-loss and take-profit orders to help manage trading risk effectively.
- Educational resources: Provides webinars and market analysis to keep traders updated on Dow Jones movements and market trends.
Related articles:
Dow Jones analysis - FAQ