Comprehensive guide to analyzing McDonalds (MCD) stock: from indicators to Top brokers

McDonald’s Corporation (MCD) is a globally recognized brand and a staple in the fast-food industry. As one of the most influential stocks on the NYSE, MCD attracts both beginner and experienced traders alike. But how do you analyze McDonald’s stock effectively to make informed trading decisions? In this article, we’ll dive into the essential indicators, chart techniques, and expert trading strategies that can help you understand MCD’s price movements. From identifying trends to spotting potential reversals, we’ll guide you through a structured approach to analyzing MCD stock. Plus, we’ll explore some of the top brokers that provide access to MCD and other major stocks, so you can confidently start trading.
A detailed McDonalds (MCD) stock chart analysis

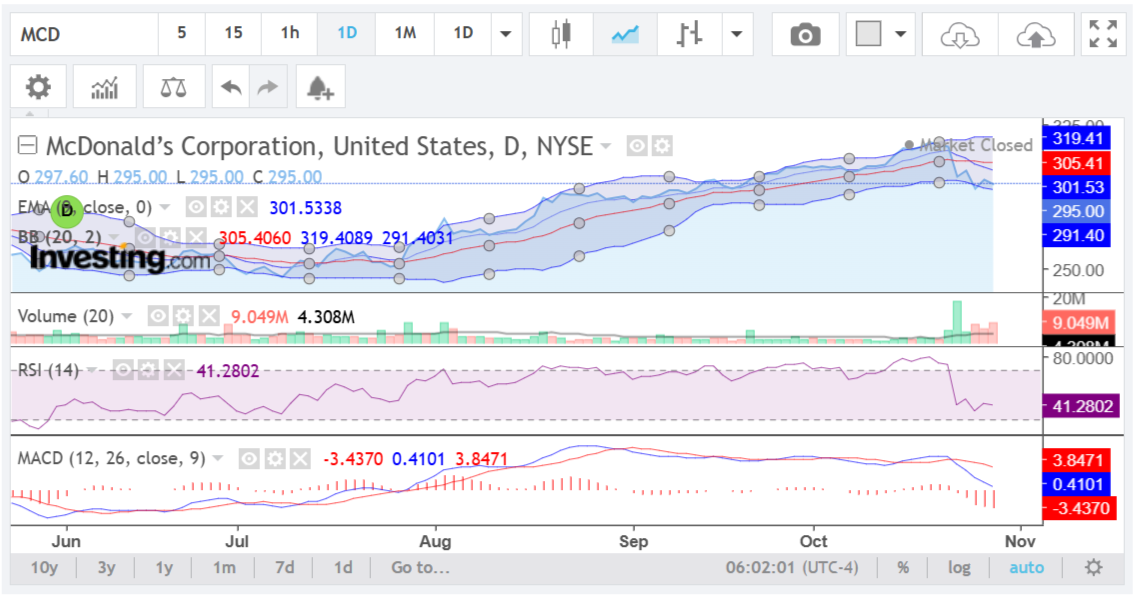
The real McDonald’s Corporation (MCD) stock chart is taken from the Investing.com website. This analysis serves as a guide for beginners on how to analyze stock charts and is not a trading recommendation.
This is a daily chart for McDonald’s Corporation, which means each candlestick represents a single trading day. This timeframe is useful for analyzing short-to-medium-term trends and gives insight into daily price movements.
Indicators in detail
1. Exponential Moving Average (EMA) – Blue Line
- The EMA is a type of moving average that gives more weight to recent prices, making it responsive to price changes. In this case, the 20-day EMA (20-period average) is used.
- Purpose: The EMA helps identify the current trend direction. When the stock price is consistently above the EMA line, it generally indicates an uptrend, and when it’s below, it can signal a downtrend.
- Current reading: On the chart, the blue EMA line is almost touching the price line, suggesting that MCD may be losing its upward momentum. If the price starts consistently falling below the EMA, it may confirm a short-term bearish trend.
→Learn more about how to use Moving Averages in CFD trading.
2. Bollinger Bands (BB) – Blue Bands with Red Midline
- Bollinger Bands consist of:
1. A middle line, which is a simple moving average (usually 20 days) — shown here as the red line.
2. An upper and lower band set at two standard deviations from the middle line (shown as blue shaded bands). - Purpose: Bollinger Bands help measure volatility. When the bands are narrow, it indicates low volatility, while wide bands indicate high volatility.
- Current reading: Recently, MCD’s price has touched the lower Bollinger Band. This is significant because:
1. Prices near the lower band may be oversold, which could suggest a potential for a bounce.
2. However, if prices stay near the lower band without bouncing, it could signal strong bearish sentiment. - Volatility analysis: The bands are widening, showing that volatility is increasing, which can often lead to larger price swings.
3. Volume (20-Day Average) – Red and Green Bars
- Volume indicates the number of shares traded during each day. Analyzing volume can help confirm the strength of a price move.
- Purpose: Strong price movements backed by high volume are usually more significant than moves on low volume. For instance, a strong down day with high volume could suggest panic selling, while a strong up day with high volume might indicate genuine buying interest.
- Current reading: In recent days, red volume bars (selling volume) are higher than green bars (buying volume), suggesting that sellers currently have more control.
4. Relative Strength Index (RSI) – Purple Line
- The RSI is an oscillator that ranges from 0 to 100, used to assess momentum.
- Purpose: RSI values:
1. Above 70 suggest the stock may be overbought (potential for a pullback).
2. Below 30 suggest the stock may be oversold (potential for a bounce). - Current reading: The RSI is around 41, which is below the midpoint of 50 but still above the oversold threshold of 30. This indicates weakened buying pressure, but not to the extent that it’s considered oversold. It implies that momentum is slightly bearish.
5. Moving Average Convergence Divergence (MACD) – Blue and Red Lines with histogram
- The MACD shows the relationship between two EMAs (usually the 12-day and 26-day EMA).
- Purpose: The MACD line crossing above or below the signal line (usually a 9-day EMA) helps identify trend changes and momentum shifts.
- Current reading:
1. The MACD line (blue) is below the signal line (red) and in negative territory, which suggests that MCD is experiencing bearish momentum.
2. The red histogram bars below the baseline show the strength of this bearish momentum, with longer bars indicating stronger downward pressure.
Analysis summary: trend, momentum, and volatility
- Trend: The price near the EMA and the MACD below the signal line both suggest a potential weakening of the uptrend or a shift toward a downtrend.
- Momentum: With the RSI under 50 and MACD in negative territory, momentum is tilted toward the downside, signaling that bearish sentiment is stronger.
- Volatility: The widening Bollinger Bands indicate that volatility is increasing, which often precedes stronger price movements in either direction.
Price prediction and trading plan of MCD stock
Based on this analysis:
1. Short-term prediction:
- Given the increased selling volume and bearish indicators (MACD and RSI), MCD may continue to face selling pressure in the near term. However, since the price is near the lower Bollinger Band, there could be a short-term bounce if buyers step in around this level.
2. Trading plan:
- Entry: Consider entering only if there is a confirmed reversal signal, like a green candlestick with increased volume or the MACD line crossing above the signal line.
- Stop Loss: A stop loss should be placed just below the recent low to limit potential losses if the stock continues to drop.
- Target: If a rebound occurs, the target could be the 20-day EMA (around $301) or the upper Bollinger Band.
Additional considerations:
Pro tip: Before investing real money, practice on demo accounts of the best brokers!
- Fundamentals: Technical analysis provides insights into price behavior, but reviewing McDonald’s financial health and earnings reports is crucial. Strong fundamentals can support a technical bounce, while weak fundamentals could lead to further declines.
- Market conditions: Broader economic conditions and market sentiment can impact MCD’s price. For example, a general downturn in the market could push MCD lower even if the technical setup suggests stability.
Top Forex brokers to trade McDonalds (MCD) stock
After understanding how to analyze McDonald’s stock using technical indicators and strategies, it’s crucial to choose a reliable broker to facilitate your trades. Whether you’re looking to take advantage of price fluctuations or planning to hold MCD shares long-term, selecting the right broker can make a significant difference. Below, we’ve compiled a list of top brokers that offer access to McDonald’s Corporation (MCD) stock, along with competitive features like low fees, robust trading platforms, and valuable research tools. Let’s take a look at the best options to help you start trading MCD effectively.
Please remember to check the Forex brokers with the best reputation among real traders.
XTB MCD stock trading
XTB is a top-tier broker with extensive global reach, serving clients across more than 190 countries and prioritizing security and transparency. Regulated by renowned authorities like the FCA, CySEC, and KNF, XTB provides a highly trustworthy trading environment. The broker offers versatile trading platforms, including xStation and MetaTrader 4, equipping traders with advanced tools to access a wide range of assets, from currency pairs to stock CFDs like MCD.US (McDonald’s Corporation). XTB also provides flexible account options, such as Standard and swap-free accounts, to meet diverse trading preferences and strategies.
Exness MCD stock trading
Exness is an exceptional choice for traders, offering a broad array of assets, including currency pairs, commodities, indices, cryptocurrencies, and CFDs on stocks like MCD (McDonald’s Corporation). With regulation by the FCA in the UK and CySEC in Cyprus, Exness prioritizes a secure and transparent trading environment. Traders can take advantage of competitive spreads through its Standard and Professional accounts, tailored to meet varied trading styles. The broker provides responsive support via email, live chat, and phone, ensuring client needs are met. Exness also offers MetaTrader 4 (MT4) and MetaTrader 5 (MT5), delivering a seamless trading experience with advanced charting tools. Overall, Exness is a comprehensive and reliable platform for traders to explore.
BlaclBull Markets MCD stock trading
BlackBull Markets provides a diverse array of trading options, including commodities, currencies, stocks, futures, indices, and cryptocurrencies, ensuring a secure trading environment as a regulated broker in Seychelles. Traders can choose from various account types—Standard, Prime, Institutional, Islamic (swap-free), and a demo account—tailored to their specific needs. The platform supports multiple trading interfaces, including MT4, MT5, cTrader, Web Trader, TradingView, and mobile apps. Additionally, BlackBull Markets offers valuable tools like BlackBull CopyTrader and BlackBull Shares, along with educational resources, including webinars and tutorials, to help traders enhance their skills. Traders can also engage in trading MCD (McDonald’s Corporation) stock CFDs, expanding their investment opportunities within the food sector.
Plus500 MCD stock trading
Plus500 is a well-established online trading platform specializing in Contract for Difference (CFD) trading, allowing traders to speculate on price movements without owning the underlying assets. It features a user-friendly interface and offers a wide variety of CFDs, including stocks, indices, commodities, cryptocurrencies, and Forex pairs, enabling traders to diversify their portfolios and explore multiple markets. Traders can also trade MCD (McDonald’s Corporation) stock CFDs on Plus500, further expanding their opportunities. The platform caters to both novice and experienced traders, providing a demo account for risk-free practice. Regulated by reputable financial authorities, Plus500 ensures a secure and transparent trading environment.
82% of retail investor accounts lose money when trading CFDs with this provider. You should consider whether you can afford to take the high risk of losing your money.
HF Markets MCD stock trading
HF Markets is an excellent choice for traders seeking a diverse range of assets, providing access to over 1,200 financial instruments, including currency pairs, energies, indices, commodities, ETFs, stocks, and bonds. The broker supports popular trading platforms like MT4 and MT5 across desktop, web, and mobile, along with a user-friendly app and VPS service for optimized performance. Various account types—Premium, Pro, Zero, and Cent—cater to different trading preferences, each with varying minimum deposits, leverage, and spreads. Beginners can start with a demo account to practice strategies risk-free before transitioning to live trading.
In addition to these features, HF Markets offers the opportunity to trade MCD (McDonald’s Corporation) stock CFDs, allowing traders to tap into the fast-food giant’s performance in the stock market. This enhances investment opportunities within the consumer sector, making HF Markets a comprehensive platform for both new and experienced traders.
Related articles:
How to analyze McDonald's (MCD) stock - FAQ