How to analyze Spotify (SPOT) stock: key indicators, strategies, and Top FX brokers

Spotify Technology (SPOT) is one of the most popular stocks in the digital streaming and tech sectors, capturing the attention of investors and traders worldwide. Analyzing Spotify’s stock is key to spotting trading opportunities and making informed investment decisions. In this article, we’ll cover essential technical indicators, charting techniques, and expert strategies to help you evaluate SPOT’s price trends, volatility, and ideal entry and exit points.
A detailed Spotify Technology (SPOT) stock chart analysis

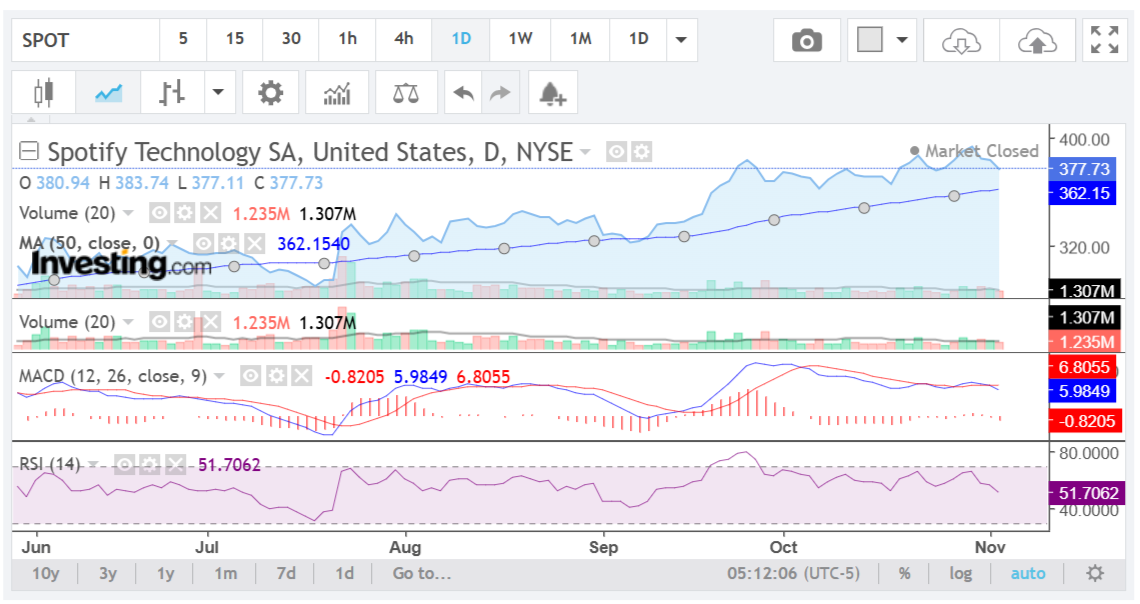
This analysis is based on a real chart of Spotify Technology (SPOT) stock, as seen on Investing.com. Please note that this is not financial advice or a recommendation; it’s meant as a guide for beginners learning to analyze stock charts.
The chart shows daily candlesticks, meaning each bar represents one day of trading activity. This timeframe is helpful for medium-term analysis, offering insights into the daily price movement, trends, and indicators.
Indicators and analysis of Spotify (SPOT) stock chart
Here’s a breakdown of each indicator present in the chart:
1. Moving Average (MA):
- The blue line labeled “MA (50)” represents the 50-day moving average.
- This line smooths out daily price fluctuations, showing the medium-term trend.
- Currently, the stock price is above the 50-day MA, which generally indicates a bullish trend. However, if it starts to cross below this line, it could signal a potential trend reversal.
→More about how to use Moving Averages in CFD trading.
2. Volume:
- The chart includes a volume indicator (green and red bars) below the price. Green bars represent trading days when the stock closed higher than it opened, while red bars represent days when it closed lower.
- High volume during an upward or downward movement can confirm the strength of that trend. Here, volume appears to be moderate, suggesting neither strong bullish nor bearish momentum currently.
MACD (Moving Average Convergence Divergence):
- This indicator, with lines in blue (MACD line) and red (Signal line), helps gauge momentum.
- The MACD line crossing above the Signal line (as it did around September) often signals a bullish phase, while crossing below (as it recently did) can signal a potential bearish phase.
- The MACD histogram (red and green bars above/below the zero line) indicates the distance between the MACD line and the Signal line, helping show the strength of momentum. The recent downtrend in the histogram bars suggests weakening momentum.
RSI (Relative Strength Index):
- RSI is a momentum oscillator that ranges between 0 and 100. It’s shown in purple at the bottom of the chart, with the current reading around 51.7.
- An RSI above 70 typically indicates an overbought condition, while below 30 indicates oversold conditions. With the RSI near the midpoint, Spotify’s stock is neither overbought nor oversold, suggesting neutral momentum.
Trend, momentum, and volatility analysis of Spotify (SPOT) stock chart
- Trend: The current trend appears cautiously bullish, as the price remains above the 50-day MA. However, recent MACD and volume signals hint at waning momentum, which may lead to consolidation or a pullback if it continues.
- Momentum: Momentum has weakened, as indicated by the MACD crossover and the flattening RSI. This suggests caution, as upward momentum is no longer as strong as it was earlier.
- Volatility: The volume indicator suggests moderate volatility. With volume levels neither extremely high nor low, any significant price movement may not have strong backing, adding caution to the current trend’s strength.
Price prediction and trading plan of Spotify (SPOT) stock
- Price prediction: Given the weakened momentum and neutral RSI, Spotify’s price may consolidate in the near term, moving sideways within a range unless stronger momentum or volume appears.
- Trading plan:
1. If Bullish: Wait for the price to close above recent highs and observe a MACD bullish crossover (blue line above red) and an RSI moving toward 70 to confirm renewed momentum.
2. If Bearish: Consider a bearish signal if the price falls below the 50-day MA and MACD remains below the Signal line, with RSI trending down.
→Read about bulls and bears in the Forex market.
These observations are based solely on technical indicators. Remember to combine chart analysis with broader market trends, fundamental analysis, and any relevant news when forming a trading plan.
Top Forex brokers to trade Spotify (SPOT) stock
Selecting the right broker is critical when trading Spotify Technology (SPOT) stock, especially if you want competitive fees, powerful trading platforms, and reliable customer support. To help you decide, we’ve put together a list of top FX brokers that offer SPOT stock trading. Known for their strong reputations, advanced tools, and trader-friendly features, these brokers are well-suited for both beginners and experienced traders. Explore our recommendations to find the broker that aligns best with your trading style and goals.
Pro tip: Before investing real money, practice on demo accounts of the best brokers!
XTB Spotify stock trading
XTB is a prominent global broker, operating in over 190 countries and providing top-tier security and transparency. Regulated by leading authorities like the FCA, CySEC, and KNF, XTB offers a high level of trust and oversight for traders. It supports versatile platforms, including xStation and MetaTrader 4, both packed with advanced tools for trading a variety of currency pairs. XTB also offers flexible account options, such as Standard and swap-free accounts, to accommodate different trading preferences. Additionally, traders can access SPOT.US – Stock CFDs, making it a convenient choice for those looking to trade Spotify Technology stock.
BlackBull Spotify stock trading
BlackBull Markets offers a wide range of trading options, including commodities, currencies, stocks, futures, indices, and Cryptocurrencies, all within a secure, regulated environment in Seychelles. Traders can choose from various account types—Standard, Prime, Institutional, Islamic (swap-free), and a demo account—designed to meet different trading needs. The platform supports multiple trading interfaces, including MT4, MT5, cTrader, Web Trader, TradingView, and mobile apps. BlackBull Markets also provides valuable tools like BlackBull CopyTrader and BlackBull Shares, along with educational resources such as webinars and tutorials to help traders improve their skills. Additionally, traders can access Spotify Technology (SPOT) stock CFDs, allowing them to expand their investment opportunities in the tech sector.
OANDA Spotify stock trading
OANDA is a well-regarded online broker known for its reliability and excellent customer service, offering a secure trading environment with competitive spreads and customizable leverage options to suit various trading strategies and risk profiles. Users can access popular platforms like MetaTrader 4 and OANDA’s own platform, OANDA Trade, which features advanced charting tools and expert advisors to support technical analysis and algorithmic trading. The broker also provides a wide range of resources, including daily and weekly market analysis, Forex news, and expert commentary to enrich the trading experience. Additionally, OANDA allows traders to trade CFDs for Spotify Technology (SPOT) shares, broadening their investment opportunities in the technology sector.
XM Spotify stock trading
Founded in 2009 and headquartered in Belize, XM Group is a reliable online broker specializing in Forex and CFD trading, known for its low minimum deposit requirement. Regulated by respected authorities like the Cyprus Securities and Exchange Commission (CySEC) and the UK’s Financial Conduct Authority (FCA), XM Group provides a secure trading environment with features like two-step authentication for enhanced account protection. The broker offers a wide range of trading options, including currency pairs, stocks, commodities, and indices, allowing for market exploration and portfolio diversification. Designed for both beginners and experienced traders, the user-friendly platform includes various tools and resources. With competitive spreads and multiple account types, XM Group meets diverse trading needs, whether you’re starting with a demo account or looking for advanced features. Additionally, XM Group offers access to Spotify Technology (SPOT) stocks as cash CFDs, giving traders the opportunity to invest strategically in a leading technology company.
Plus500 Spotify stock trading
Plus500 is a well-established online trading platform specializing in Contract for Difference (CFD) trading, allowing traders to speculate on price movements without owning the underlying assets. With a user-friendly interface, Plus500 offers a wide variety of CFDs, including stocks, indices, commodities, cryptocurrencies, and Forex pairs, enabling traders to diversify their portfolios and access multiple markets. In addition to Tesla stock CFDs, traders can also trade Spotify (SPOT) stock CFDs on Plus500, providing even more opportunities to invest in leading tech companies. The platform caters to both novice and experienced traders, offering a demo account for risk-free practice. Regulated by reputable financial authorities, Plus500 ensures a secure and transparent trading environment.
82% of retail investor accounts lose money when trading CFDs with this provider. You should consider whether you can afford to take the high risk of losing your money.
Related articles:
Spotify (SPOT) stock analysis -FAQ