Master Tesla stock analysis: key techniques, expert tips, and best FX brokers

Tesla, one of the market’s most dynamic and volatile stocks, presents unique opportunities for traders and investors alike. But how do you effectively analyze Tesla’s stock performance, spot trends, and make strategic trading decisions? This comprehensive guide will dive deep into essential technical indicators such as EMA, Bollinger Bands, RSI, and volume analysis. We’ll also explore chart techniques that help you understand Tesla’s price movements and expert trading strategies you can use to maximize potential gains or minimize losses. Finally, we’ll introduce you to some top brokers where you can easily trade Tesla stock with advanced tools and resources.
A detailed Tesla stock chart analysis
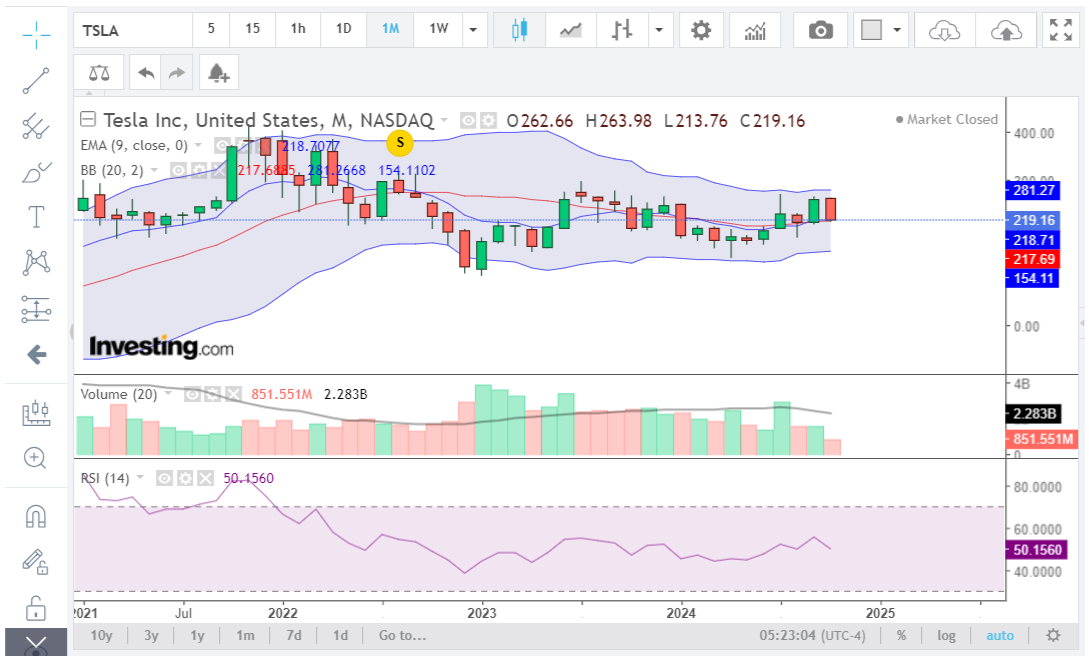
This real chart of Tesla’s stock is taken from the Investing.com website. Below, I will provide a beginner-friendly guide on how to analyze this chart, considering various technical indicators. Keep in mind that this is not financial advice but simply a guide to help you understand the tools used in technical analysis.
Time period and candlestick patterns of Tesla stock chart
- Timeframe: The chart is based on a 1-Month (1M) timeframe. Each candlestick represents one month’s worth of price action. In long-term trading, a monthly chart is crucial for identifying long-term trends, reversals, and price consolidation patterns.
- Candlestick patterns: Green candlesticks show months when Tesla’s stock price closed higher than it opened, while red candlesticks show months when the price closed lower. The body of each candle shows the opening and closing price, while the wicks (or shadows) indicate the highest and lowest prices during the month.
For newcomers: Understanding Japanese candlestick charts: basic figures and main patterns
Detailed analysis indicator of Tesla stock chart
1. Exponential Moving Average (EMA 9)
- Color: Red line on the chart.
- Purpose: EMA tracks the stock’s average price over the last 9 periods (months, in this case) and assigns more weight to recent prices. This makes it a useful indicator for gauging short-term trends.
- What it shows: The current price is slightly above the EMA (currently at around $218). When the price is above the EMA, it typically signals a bullish trend—meaning the stock is gaining momentum. If the price falls below the EMA, it would signal a bearish trend. In this case, the stock appears to be slightly bullish in the short term.
2. Bollinger Bands (BB 20, 2)
- Color: Blue bands and a red middle line (which is the 20-period moving average).
- Purpose: Bollinger Bands measure volatility by showing how far the price deviates from its average. The bands consist of an upper band, a lower band, and a middle-moving average line. The upper and lower bands are placed two standard deviations away from the moving average, which makes them sensitive to market volatility.
- What it shows:
1. Upper band (around $281): The current price is near this level, suggesting that the stock is in a potentially overbought zone. A price near the upper band can signal that the stock might be due for a pullback or price correction.
2. Middle band (around $218): This is the 20-period moving average. The stock is slightly above this line, which supports the short-term bullish case.
3. Lower band (around $154): If the stock price reverses and moves downwards, the lower band might act as a support level, or a price where buyers may come in again. - Volatility: The bands are widening, meaning volatility is increasing. In volatile markets, prices can make larger, more dramatic moves. Wide bands usually accompany big price swings, while narrow bands indicate periods of low volatility.
3. Volume (20)
- Color: Green and red bars.
- Purpose: Volume represents the number of shares traded in a given period. The green bars indicate more buying activity, while the red bars represent more selling pressure. Higher volume indicates stronger conviction in the price movement, while lower volume suggests weaker sentiment.
- What it shows: In recent months, the volume is moderate (about 851.55 million shares), which shows that while there’s some buying interest, it is not overwhelmingly strong. Large price movements without significant volume can signal a lack of market conviction, meaning the trend might not sustain itself for long.
4. Relative Strength Index (RSI 14)
- Color: Purple line.
- Purpose: The RSI measures momentum on a scale from 0 to 100. A reading above 70 is considered overbought (indicating that the stock might soon see a downward correction), while a reading below 30 is considered oversold (indicating that the stock might be due for a bounce back up).
- What it shows: The RSI is around 50.15, which is neutral. This suggests that there’s no significant buying or selling momentum right now. The stock isn’t overbought or oversold, which often implies sideways trading or a period of consolidation before a more significant move.
Trend analysis of Tesla stock chart
- Trend: The chart shows a mild bullish trend in the short term as the price is above both the EMA and the middle Bollinger Band. However, the RSI indicates neutral momentum, meaning the upward move isn’t very strong. It suggests that while the price may continue to rise, it’s likely to face resistance at the upper Bollinger Band.
→More about bulls and bears in the Forex market.
- Reversal signals: If the stock fails to break above the upper Bollinger Band ($281) and the RSI starts falling, it could signal a price reversal. This would mean a return towards the middle band or even the lower band.
Momentum and volatility analysis of Tesla stock chart
- Momentum: The RSI hovering around 50 means the stock has weak momentum. Neither buyers nor sellers are dominating the market at the moment. A break above 60 on the RSI would signal stronger bullish momentum, while a break below 40 would indicate increasing bearish momentum.
- Volatility: The Bollinger Bands are widening, which signals that volatility is increasing. This could lead to larger price swings in the near future, making it a more uncertain time for the stock.
Price prediction of Tesla stock
Based on the current indicators, the stock might attempt to continue towards the upper Bollinger Band around $281. If it fails to break above this level, the price could reverse, pulling back towards the middle Bollinger Band ($218) or even the lower Bollinger Band ($154) in a more bearish scenario.
Trading plan (for educational purposes) of Tesla stock
This is an example of how a beginner might approach a trade based on these indicators:
Bullish scenario:
- Entry: Consider entering a long position if the price breaks and closes above the upper Bollinger Band ($281) with strong volume and RSI moving above 60.
- Target: Set a target for further upward movement, possibly aiming for new highs. But keep in mind that this target should be based on other resistance levels.
- Stop-loss: Place a stop-loss just below the middle Bollinger Band ($218) to protect against a bearish reversal.
Pro tip: Before investing real money, practice on demo accounts of the best brokers!
Bearish scenario:
- Entry: If the price hits the upper band ($281) and fails to break through, consider taking a short position.
- Target: The short-term target could be the middle band ($218) or lower depending on price action and market conditions.
- Stop-loss: Place a stop-loss above the upper band, perhaps around $281, to protect against an unexpected breakout.
→Safeguard your investments by utilizing risk management tools such as stop-loss orders, position sizing, and risk/reward ratios to improve your trading outcomes!!!
Tesla’s stock is in a period of slight upward momentum but with increasing volatility. The stock is close to the upper boundary of its Bollinger Bands, which often signals overbought conditions and a potential reversal. The neutral RSI suggests that the stock doesn’t have strong momentum in either direction. This analysis can guide you in understanding how technical indicators work but should not be taken as financial advice. Always do your own research before making investment decisions.
Top Forex brokers to trade Tesla stock
After understanding the technical analysis and strategies behind trading Tesla stock, the next step is to choose the right broker. Your choice of broker can significantly impact your trading experience, providing the tools, platforms, and market access you need to execute your trades efficiently. Below, we’ve compiled a list of the top FX brokers that allow you to trade Tesla stock, complete with detailed information about their trading platforms, fees, and additional services to help you make an informed decision.
Pro tip: Before signing up with a Forex broker, check Forex brokers with the best reputation among real traders.
XTB Tesla stock trading
XTB stands out with a strong global presence, operating in over 190 countries, while ensuring top-tier security and transparency. It is regulated by leading authorities such as the FCA, CySEC, and KNF, offering a robust level of trust and oversight. Traders can take advantage of versatile platforms like xStation and MetaTrader 4, equipped with advanced tools for trading various currency pairs. XTB provides flexible account options, including Standard and swap-free accounts, tailored to different trading needs.
In addition, XTB offers access to investing in TSLA.US – Cashstocks with ZERO commission (Tesla Inc., Commission: 0 USD, Minimum transaction value: 10 USD) and TSLA.US – Stock CFDs, which track the market value of Tesla Motors Inc. CFDs. The broker also enhances the trading experience by offering valuable resources such as daily market updates, economic calendars, and educational webinars.

Exness Tesla stock trading
Exness is a standout choice for traders, offering a wide range of options, including currency pairs, commodities, indices, cryptocurrencies, and Tesla CFDs. Regulated by the FCA in the UK and CySEC in Cyprus, Exness ensures a secure trading environment. Traders can benefit from competitive spreads available through its Standard and Professional accounts, each tailored to meet specific trading needs. The broker provides reliable support via email, live chat, or phone. Exness also offers access to MetaTrader 4 (MT4) and MetaTrader 5 (MT5), delivering an intuitive trading experience with advanced charting tools. Overall, Exness provides a comprehensive and robust trading platform well worth exploring.
Plus500 Tesla stock trading
Plus500 is a well-established online trading platform specializing in Contract for Difference (CFD) trading, allowing traders to speculate on price movements without owning the underlying assets. It features a user-friendly interface and offers a wide variety of CFDs, including stocks, indices, commodities, cryptocurrencies, and Forex pairs, enabling traders to diversify their portfolios and explore multiple markets. Traders can also trade Tesla stock CFDs on Plus500, further expanding their opportunities. The platform caters to both novice and experienced traders, offering a demo account for risk-free practice. Regulated by reputable financial authorities, Plus500 provides a secure and transparent trading environment.

82% of retail investor accounts lose money when trading CFDs with this provider. You should consider whether you can afford to take the high risk of losing your money.
HF Markets Tesla stock trading
HF Markets is a top choice for traders seeking a diverse range of assets, offering access to over 1,200 financial instruments, including currency pairs, energies, indices, commodities, ETFs, stocks, and bonds. The broker supports popular platforms like MT4 and MT5 across desktop, web, and mobile, with a user-friendly app and VPS service for optimized performance. Various account types—Premium, Pro, Zero, and Cent—are available, catering to different trading preferences with varying minimum deposits, leverage, and spreads. Beginners can start with a demo account to practice strategies risk-free before transitioning to live trading.
HF Markets also provides Tesla Inc – Nasdaq – Single Stock trading with tailored specifications for each account type (Premium, Zero, Premium Pro). Each account offers trading in USD with a lot size of 1 share, a minimum contract size of 1 lot, and a margin requirement of 20%. Traders benefit from a competitive commission of 0.10 USD per share round turn, a minimum price increment of 0.01, and no restrictions on limit and stop levels. All accounts come with negative balance protection, and Tesla is available under the platform symbol #Tesla.

AvaTrade Tesla stock trading
AvaTrade, established in 2006, is a trusted Forex broker with over 300,000 global clients and is regulated by top authorities like the Central Bank of Ireland and ASIC. It offers a reliable platform for trading cryptocurrencies, featuring competitive spreads, flexible leverage, and various account options.
Traders can also trade Tesla stock CFDs on AvaTrade using popular platforms like MT4 and MT5, equipped with advanced charting tools and fast execution. The broker provides essential risk management features such as stop-loss and take-profit orders, alongside educational resources like webinars and market analysis to support informed trading.
Related articles:
How to analyze Tesla stock chart - FAQ